Commercial HVAC Statistics: How US Commercial Buildings Heat and Cool (CBECS 2018)
- Primary data
- EIA 2018 Commercial Buildings Energy Consumption Survey (CBECS), public use microdata and detailed tables
- Data period
- Calendar year 2018 (reference year of the latest CBECS)
- Latest release used
- 2022-12-01
- Next release
- No date announced by EIA as of 2026-11-02; no CBECS cycle after 2018 has published results
- Geography
- United States, commercial buildings over 1,000 square feet (excludes manufacturing)
- Sources
- 19 (19 Tier 1)
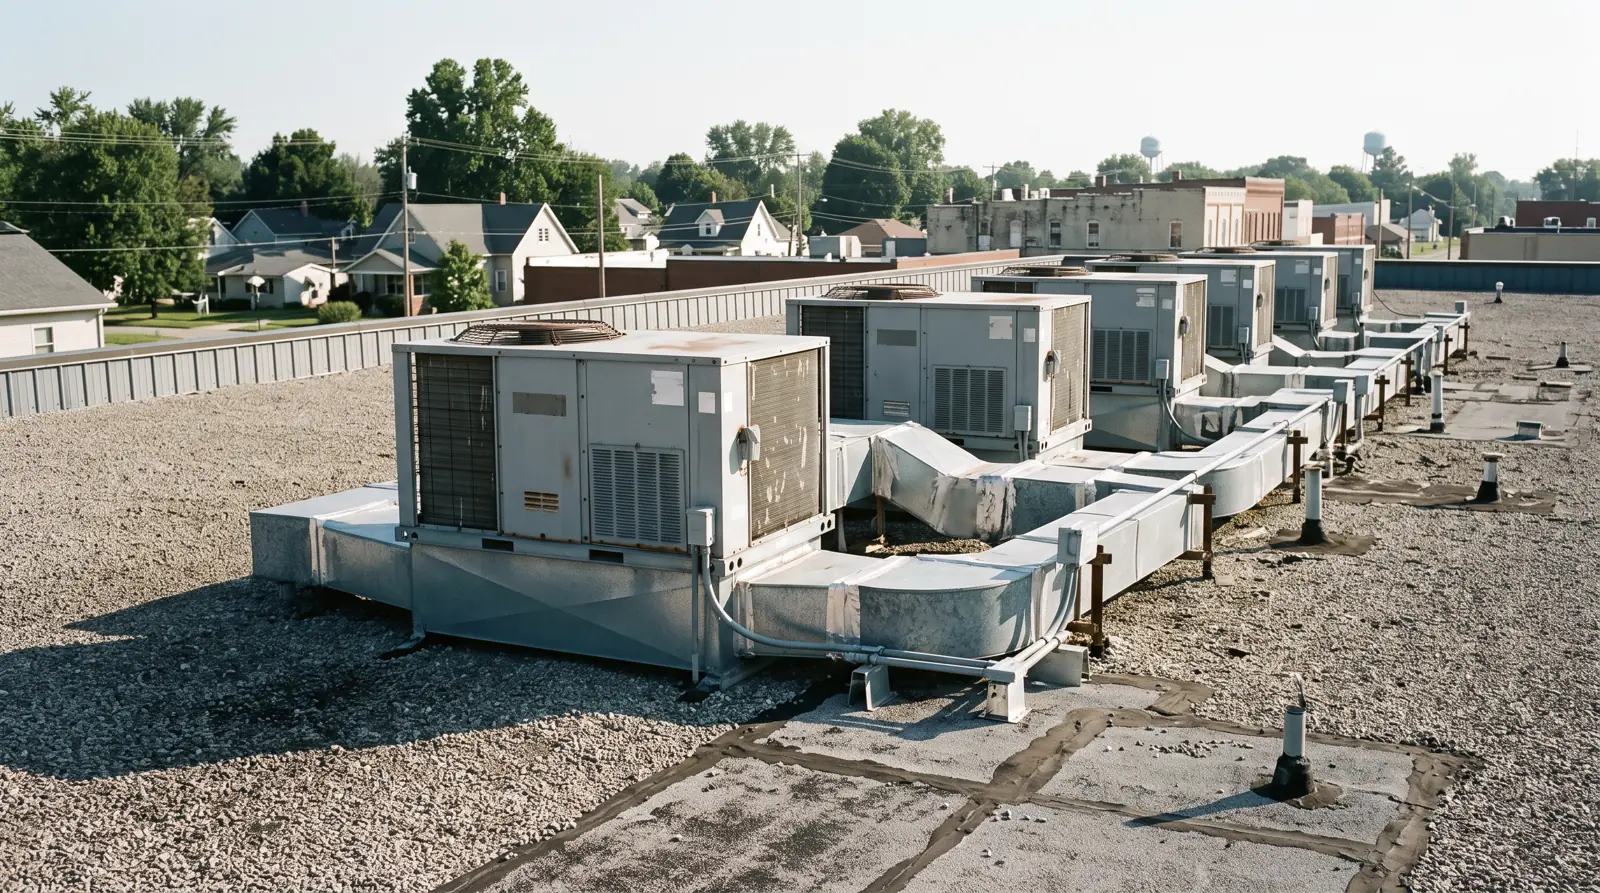
Packaged units, mostly rooftop units, served 51.7% of the air-conditioned floor area in US commercial buildings in 2018, according to our analysis of EIA's 2018 CBECS microdata. These commercial HVAC statistics also show 2.40 million buildings relied on a packaged unit as main cooling, and packaged units led heating too, at 38.9% of heated buildings.
How to read these commercial HVAC statistics: buildings, floorspace and served area
The same equipment can look like a minority or a majority depending on the denominator. This report uses three measures and labels each one.
Share of buildings: Weighted count of buildings that use a type of equipment anywhere, divided by all 5.9 million US commercial buildings in 2018. One small shop and one hospital count the same.
Share of floorspace (any use): Total square feet of buildings that use the equipment anywhere, divided by all commercial floorspace (96.4 billion square feet in 2018, EIA Table B1). This is the figure EIA publishes. A tower with one packaged unit on a lobby counts all its floors.
Share of floor area served: Our measure. Each building's cooled (or heated) square feet are split across its systems using the percent-cooled answers it gave EIA, so the shares add to 100%. US commercial buildings had 68.3 billion air-conditioned square feet and 77.5 billion heated square feet in 2018.
Main equipment: EIA's derived variable for the system that conditions the most space in a building (MAINCL for cooling, MAINHT for heating), first available in the 2018 survey.
Any-use shares overlap. In 2018 the any-use cooling shares summed to 92.0% of all buildings while 78.2% of buildings were cooled, about 1.18 cooling types per cooled building; heating shares summed to 112.3%, or 1.36 types per heated building. That is why the served-area column exists.
Packaged units cool about half of the air-conditioned floor area
Packaged units are the default cooling system in US commercial buildings by every measure, but chillers carry far more floor area than their building count suggests.
In 2018, packaged units served 51.7% of US commercial air-conditioned floor area, or 35.3 billion square feet, according to our weighted allocation of the EIA 2018 CBECS microdata. The estimate has a relative standard error of 2.6%.
Share of US commercial cooled floor area served by each equipment type, 2018 (shares sum to 100%)
Source: U.S. EIA, 2018 CBECS public use microdata. HVAC Business Brokers Research Desk calculations (weighted, cooled area allocated by reported percent cooled).
About 2.6 million buildings used a packaged unit for some cooling in 2018, and 2.40 million named it their main cooling system. That is 93.7% of the buildings that have one: when a commercial building has a packaged unit, it is almost always the primary system.
Central chillers sit at the other end. They were used in 3.4% of buildings in 2018, about 165 thousand had a chiller as the main system, yet chillers served 19.0% of cooled floor area. Residential-type split systems were the main system in 1.13 million buildings and served 10.4% of cooled area. EIA puts the average chiller building at 88,800 square feet, against 21,900 for packaged AC and 14,000 for residential-type central AC.
| Equipment | % of buildings using it | % of floorspace in buildings using it | % of air-conditioned floor area it serves | Floor area served (million sq ft) | Buildings where it is the main system (thousand) | Main system, % of cooled buildings | RSE of served share (%) |
|---|---|---|---|---|---|---|---|
| Packaged unit | 43.3 | 58.6 | 51.7 | 35,310 | 2,404 | 51.9 | 2.6 |
| Central chiller (any fuel) | 3.4 | 18.5 | 19.0 | 12,981 | 165 | 3.6 | 4.7 |
| Residential-type split system | 22.1 | 18.9 | 10.4 | 7,082 | 1,128 | 24.4 | 6.1 |
| Heat pump | 8.3 | 11.6 | 6.9 | 4,704 | 355 | 7.7 | 9.4 |
| Individual (room) air conditioner | 12.4 | 14.2 | 5.9 | 4,043 | 465 | 10.1 | 8.3 |
| District chilled water | 0.9 | 4.3 | 5.1 | 3,495 | 53 | 1.2 | 13.7 |
| Swamp (evaporative) cooler | 1.4 | 2.2 | 0.9 | 603 | 58 | 1.2 | 11.6 |
Any-use columns sum to more than 100% of cooled buildings because buildings use more than one type. The served-area column allocates each building's cooled square feet across its systems and sums to 100%. Q = withheld (RSE over 50% or fewer than 20 sampled buildings).
Source: [1][4] U.S. Energy Information Administration; U.S. Energy Information Administration
For an HVAC company owner, the packaged-unit numbers describe the bulk of commercial service and replacement calls by building count, while chiller work concentrates in fewer, much larger buildings.
How are commercial buildings heated? Packaged units and furnaces by count, boilers by size
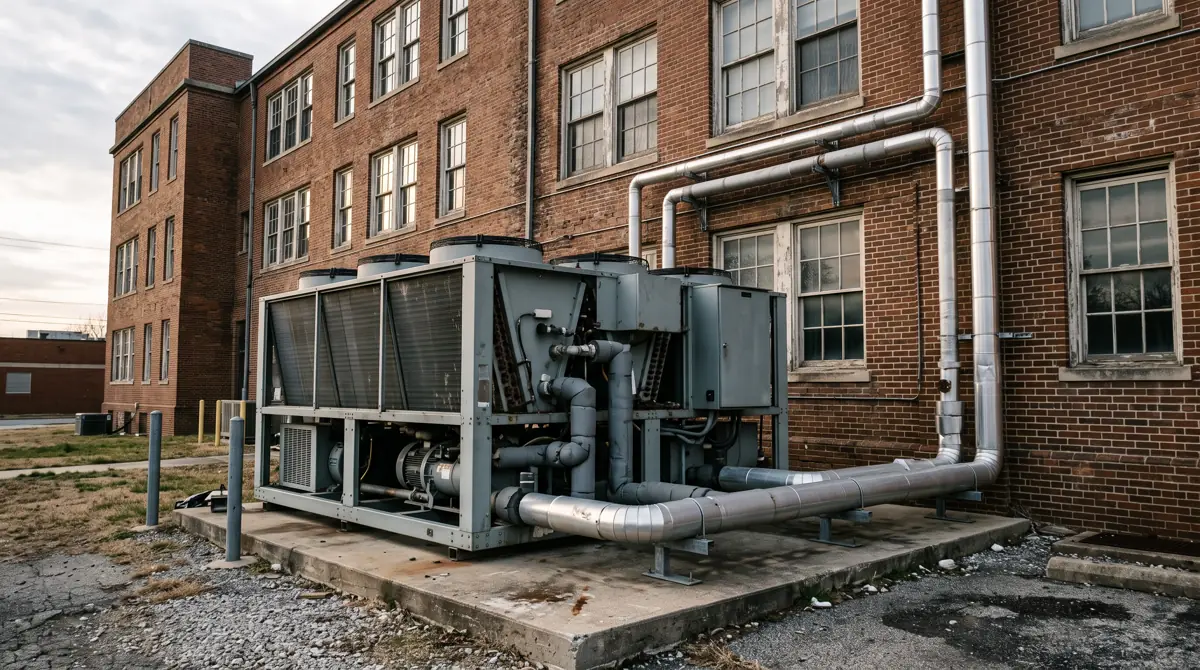
Heating equipment splits by building size. EIA puts the average furnace building at 10,700 square feet, the average packaged-heating building at 22,000 and the average boiler building at 41,000.
Packaged units were the main heating equipment in 38.9% of heated US commercial buildings in 2018, furnaces in 27.9%, individual space heaters in 11.9%, boilers in 10.5% and heat pumps in 7.9% (EIA 2018 CBECS microdata).
Heating equipment by share of US commercial buildings and share of floorspace, 2018 (more than one may apply)
Source: U.S. EIA, 2018 CBECS public use microdata (matches EIA's 2018 Building Characteristics Highlights). HVAC Business Brokers Research Desk calculations.
Boilers were used in 11.9% of buildings but in buildings holding 29.7% of floorspace, matching EIA's 2018 Building Characteristics Highlights. By served area, boilers heated 24.6% of heated floor area in 2018, second only to packaged units at 38.9%. Furnaces were the opposite: 27.4% of buildings, 11.6% of heated area.
Packaged heating split almost evenly by fuel in 2018: 959 thousand buildings had a natural gas packaged unit as main heating and 898 thousand an electric one.
| Equipment | % of buildings using it | % of floorspace in buildings using it | % of heated floor area it serves | Floor area served (million sq ft) | Buildings where it is the main system (thousand) | Main system, % of heated buildings |
|---|---|---|---|---|---|---|
| Packaged unit | 37.0 | 49.8 | 38.9 | 30,130 | 1,908 | 38.9 |
| Boiler | 11.9 | 29.7 | 24.6 | 19,049 | 514 | 10.5 |
| Furnace | 27.4 | 17.9 | 11.6 | 8,965 | 1,366 | 27.9 |
| Individual space heater | 21.1 | 21.8 | 7.1 | 5,474 | 585 | 11.9 |
| District steam or hot water | 1.4 | 6.7 | 7.0 | 5,450 | 78 | 1.6 |
| Heat pump | 11.4 | 15.6 | 7.0 | 5,388 | 388 | 7.9 |
| Other (fireplaces, duct reheat, solar, other) | n/a | n/a | 3.9 | 2,998 | 62 | 1.3 |
Heated floor area is the part of each building heated to at least 50F. Any-use shares overlap; served-area shares sum to 100%. Duct reheat appears inside 'Other' in the served-area allocation.
Source: [1][4] U.S. Energy Information Administration; U.S. Energy Information Administration
For an owner, boiler service and retrofit work follows square footage in schools, hospitals and offices, while furnace work follows building count in small commercial property.
Retail runs on rooftop units; hospitals and schools run on chillers and boilers
Retail is overwhelmingly packaged; health care, education and lodging lean on central plants.
Packaged units served 85.1% of the cooled floor area in US retail and mall buildings in 2018, 78.1% in food sales, 74.7% in warehouses and 71.5% in food service. They served 46.3% in offices, 39.4% in education, 31.9% in health care and 25.3% in lodging (EIA 2018 CBECS microdata).
Share of each building type's cooled floor area served by packaged units, US, 2018
Source: U.S. EIA, 2018 CBECS public use microdata. HVAC Business Brokers Research Desk calculations.
The central-plant pattern shows in the same table. Buildings with boilers held 59.9% of education floorspace and 54.6% of health care floorspace in 2018; buildings with chillers held 45.0% of health care floorspace and 34.7% of education floorspace.
| Rank | Principal building activity | Buildings (thousand) | Floorspace (million sq ft) | % of cooled floor area served by packaged units | % of cooled buildings with packaged main cooling | % of floorspace in buildings with chillers | % of floorspace in buildings with boilers | % of floorspace in buildings heating with heat pumps | % of floorspace in buildings with BAS |
|---|---|---|---|---|---|---|---|---|---|
| 1 | Mercantile (retail and malls) | 517 | 10,865 | 85.1 | 76.3 | 6.0 | 15.8 | 24.6 | 46.6 |
| 2 | Food sales | 163 | 1,005 | 78.1 | 60.3 | Q | Q | Q | 44.3 |
| 3 | Warehouse and storage | 1,004 | 17,717 | 74.7 | 47.2 | 2.4 | 8.2 | 8.3 | 13.9 |
| 4 | Food service | 286 | 1,385 | 71.5 | 71.5 | Q | 13.6 | Q | 22.1 |
| 5 | Religious worship | 439 | 5,473 | 55.4 | 50.0 | 7.6 | 27.4 | 16.7 | 30.0 |
| 6 | Service | 867 | 6,245 | 54.7 | 40.2 | Q | 14.5 | 6.2 | 7.3 |
| 7 | Public assembly | 488 | 7,105 | 52.6 | 52.8 | 15.8 | 30.0 | 11.8 | 42.4 |
| 8 | Public order and safety | 81 | 1,534 | 47.2 | 48.8 | 27.4 | 38.9 | Q | 44.8 |
| 9 | Office | 970 | 16,578 | 46.3 | 51.7 | 33.4 | 34.5 | 16.4 | 58.4 |
| 10 | Education | 437 | 13,638 | 39.4 | 44.1 | 34.7 | 59.9 | 19.4 | 71.6 |
| 11 | Other (incl. laboratory) | 113 | 2,444 | 32.5 | 44.8 | 38.0 | 34.8 | 18.7 | 57.7 |
| 12 | Health care | 137 | 4,054 | 31.9 | 57.0 | 45.0 | 54.6 | 17.0 | 75.7 |
| 13 | Lodging (incl. nursing) | 207 | 6,856 | 25.3 | 22.0 | 19.3 | 42.9 | 24.9 | 34.1 |
Vacant buildings omitted from the ranking. Health care = inpatient and outpatient; lodging includes nursing homes; mercantile = retail and malls. Q = withheld (RSE over 50% or fewer than 20 sampled buildings).
Source: [1][6] U.S. Energy Information Administration; U.S. Energy Information Administration
For an owner, the building mix in a service area sets the skills a commercial HVAC company needs: a retail-heavy market is a rooftop-unit market, while hospitals and campuses need chiller and boiler capability.
Most rooftop-unit buildings run without building automation
Building automation systems are standard in large buildings and rare in the small, packaged-unit buildings that make up most of the stock.
16.0% of US commercial buildings had a building automation system in 2018, and those buildings held 42.1% of floorspace (EIA 2018 CBECS microdata). Where a system existed, it controlled cooling in 94.5% of buildings.
Share of US commercial buildings with a building automation system, by size, 2018
Source: U.S. EIA, 2018 CBECS public use microdata. HVAC Business Brokers Research Desk calculations.
Among the 2.40 million buildings with a packaged unit as main cooling in 2018, 21.8% had a building automation system. About 1.88 million did not, 78.2% of the group (RSE 5.1%). That count is our calculation and is not published by EIA.
| Building size | Buildings (thousand) | % with a building automation system | % of cooled buildings with packaged main cooling | % of cooled buildings with chiller main cooling | % with regular HVAC maintenance |
|---|---|---|---|---|---|
| 1,001 to 10,000 sq ft | 4,192 | 10.0 | 48.6 | Q | 53.1 |
| 10,001 to 50,000 sq ft | 1,367 | 24.0 | 60.1 | 5.4 | 73.3 |
| 50,001 to 200,000 sq ft | 310 | 53.3 | 53.7 | 19.1 | 90.9 |
| Over 200,000 sq ft | 49 | 70.5 | 43.2 | 36.8 | 94.8 |
Q = withheld (RSE over 50% or fewer than 20 sampled buildings).
Source: [1] U.S. Energy Information Administration
Other controls were less common. Economizers were in 12.6% of buildings (35.3% of floorspace), variable air volume systems in buildings with 30.3% of floorspace, demand controlled ventilation 10.9%, dedicated outdoor air systems 9.3%, and smart thermostats in 5.5% of buildings in 2018.
For an owner, small and mid-size packaged-unit buildings are where central controls are least common, while 76.9% of packaged-main buildings already reported regular HVAC maintenance in 2018.
Heat pumps heat 11.4% of commercial buildings but a smaller share of floor area
Heat pumps were a minority heating technology in commercial buildings in 2018, and respondent knowledge limits what the survey can say about packaged heat pumps.
About 673 thousand US commercial buildings, 11.4%, used heat pumps for heating in 2018, in buildings holding 15.6% of floorspace. Heat pumps were the main heating system in 7.9% of heated buildings and served 7.0% of heated floor area (EIA 2018 CBECS microdata).
Of heat-pump-heated buildings that answered the question, 54.7% reported a variable refrigerant flow (VRF) system, about 228 thousand buildings. Of buildings with packaged heating, 31.5% said the unit contained a heat pump and 40.9% did not know, so the packaged heat pump count is too uncertain to publish.
How much energy do commercial buildings use for HVAC?
Heating, cooling and ventilation account for about half of the energy US commercial buildings use, with space heating the largest single end use.
US commercial buildings used 6,787 trillion Btu of major fuels in 2018. Space heating took 2,167 trillion Btu, ventilation 728 and cooling 589, a combined 3,484 trillion Btu or 51.3% of the total, computed from EIA Table E1. EIA's own highlights put space heating at 32%.
Space heating, cooling and ventilation as a share of major-fuel consumption, by building activity, US, 2018
Source: U.S. EIA, 2018 CBECS Table E1. HVAC Business Brokers Research Desk calculations.
By intensity, space heating used 25.0 thousand Btu per square foot in 2018, cooling 7.0 and ventilation 8.0, in buildings using a major fuel for each end use (EIA Table E2). Office buildings spent 214 trillion Btu on ventilation, more than on cooling or any other end use except heating.
| Principal building activity | All major fuels (trillion Btu) | Space heating (trillion Btu) | Cooling (trillion Btu) | Ventilation (trillion Btu) | HVAC share of total (%) | Heating intensity (thousand Btu per sq ft) | Cooling intensity (thousand Btu per sq ft) |
|---|---|---|---|---|---|---|---|
| Public assembly | 583 | 277 | 96 | 28 | 68.8 | 41.4 | 15.8 |
| Religious worship | 193 | 88 | 21 | 16 | 64.8 | 17.8 | 4.0 |
| Service | 318 | 166 | 22 | 16 | 64.2 | 33.7 | 5.0 |
| Education | 854 | 362 | 92 | 65 | 60.8 | 27.6 | 7.3 |
| Vacant | 27 | 11 | 4 | 1 | 59.3 | 17.6 | 5.4 |
| Office | 1,093 | 325 | 81 | 214 | 56.7 | 20.1 | 5.1 |
| Warehouse and storage | 528 | 208 | 52 | 24 | 53.8 | 15.8 | 3.9 |
| Health care | 581 | 178 | 36 | 98 | 53.7 | 44.8 | 9.8 |
| Public order and safety | 133 | 45 | 14 | 9 | 51.1 | 30.2 | 9.2 |
| Mercantile | 953 | 238 | 71 | 116 | 44.6 | 22.8 | 6.7 |
| Lodging | 598 | 108 | 41 | 87 | 39.5 | 15.7 | 6.0 |
| Other | 328 | 83 | 28 | 17 | 39.0 | 39.5 | 13.7 |
| Food service | 365 | 44 | 25 | 23 | 25.2 | 35.6 | 19.1 |
| Food sales | 233 | 33 | 7 | 13 | 22.7 | 36.6 | 7.1 |
| All buildings | 6,787 | 2,167 | 589 | 728 | 51.3 | 25.0 | 7.0 |
Consumption and intensities from EIA Tables E1 and E2; HVAC share computed by HVAC Business Brokers Research Desk. Intensities are per square foot of buildings using a major fuel for that end use, so they cannot be added together.
Source: [9][10] U.S. Energy Information Administration; U.S. Energy Information Administration
For an owner, HVAC is about half of a typical commercial customer's energy use, measured in Btu rather than dollars.
What changed between the 2012 and 2018 surveys, and why the trend is shaky
Packaged cooling grew between the 2012 and 2018 CBECS, but EIA rewrote the equipment questions in 2018, so some moves are partly a questionnaire effect.
Packaged air conditioning appeared in 34.4% of US commercial buildings in the 2012 CBECS and 43.3% in 2018; by floorspace, 51.8% and 58.6%. Furnaces jumped from 13.6% to 27.4% of buildings and packaged heating fell from 50.4% to 37.0%, swings too large to read as real change in six years.
| Measure (any use) | 2012 CBECS | 2018 CBECS |
|---|---|---|
| Packaged AC units, % of buildings | 34.4 | 43.3 |
| Packaged AC units, % of floorspace | 51.8 | 58.6 |
| Central chillers, % of floorspace | 19.6 | 18.5 |
| Heat pumps for cooling, % of buildings | 12.5 | 8.3 |
| Packaged heating units, % of buildings | 50.4 | 37.0 |
| Furnaces, % of buildings | 13.6 | 27.4 |
| Boilers, % of floorspace | 25.8 | 29.7 |
2012 from published Tables B38 to B41; 2018 from microdata. EIA restructured the 2018 equipment questions by energy source and dropped several 2012 equipment follow-ups, so large moves (furnaces, packaged heating) partly reflect the questionnaire.
Source: [12][13][14][15][1][17] U.S. Energy Information Administration; U.S. Energy Information Administration; U.S. Energy Information Administration; U.S. Energy Information Administration; U.S. Energy Information Administration; U.S. Energy Information Administration
EIA's 2018 questionnaire outline shows the reason: heating and cooling equipment were asked by energy source for the first time, main-equipment and percent-served follow-ups were added, and several 2012 equipment questions were dropped.
One age signal is in the 2018 data: 20.6% of buildings built before 2000, 917 thousand of 4,457 thousand, reported an HVAC equipment upgrade since 2000 (EIA 2018 CBECS microdata).
What the 2018 equipment mix means for a commercial HVAC company
The data describe the installed base a commercial contractor services; they do not measure contractor revenue or market size.
- Packaged units are the volume product: 2.40 million main-system buildings in 2018, the largest groups being offices (485 thousand) and retail (366 thousand).
- Chillers and boilers are the square-footage product: 19.0% of cooled area and 24.6% of heated area in 2018, concentrated in health care, education and offices.
- Controls are thin below 50,000 square feet: 10.0% and 24.0% BAS adoption in the two smaller size classes in 2018.
- Recurring maintenance already covers 60.1% of buildings and 80.9% of floorspace (2018), so service-agreement revenue is common in commercial work.
Owners weighing a sale can read how buyers think about commercial service revenue in our guide to selling an HVAC business. Labor supply for this work is covered in our technician shortage report.
The numbers in one list
- Packaged units served 51.7% of US commercial air-conditioned floor area in 2018, about 35.3 billion square feet (EIA 2018 CBECS microdata, our calculation; RSE 2.6%).[1]
- Packaged units were used in 43.3% of US commercial buildings and in buildings holding 58.6% of floorspace in 2018 (EIA 2018 CBECS).[1][4]
- Floorspace in buildings that have a packaged unit overstates the area packaged units serve: packaged units served 36.6% of all US commercial floorspace in 2018, 22.0 points below the 58.6% any-use figure.[1]
- 2.40 million US commercial buildings named a packaged unit as main cooling in 2018, 51.9% of cooled buildings (EIA 2018 CBECS microdata).[1]
- Of US commercial buildings with packaged main cooling in 2018, 21.8% had a building automation system and 76.9% had regularly scheduled HVAC maintenance (EIA 2018 CBECS microdata).[1]
- Central chillers were used in 3.4% of US commercial buildings in 2018 but served 19.0% of air-conditioned floor area (EIA 2018 CBECS microdata).[1]
- Packaged units were the main heating equipment in 38.9% of heated US commercial buildings in 2018, furnaces in 27.9% and boilers in 10.5% (EIA 2018 CBECS microdata).[1]
- Boilers served 24.6% of US commercial heated floor area in 2018, second to packaged units at 38.9% (EIA 2018 CBECS microdata, our allocation).[1]
- Heat pumps heated 11.4% of US commercial buildings in 2018 but served 7.0% of heated floor area (EIA 2018 CBECS microdata).[1]
- 16.0% of US commercial buildings had a building automation system in 2018, rising from 10.0% of buildings of 1,001 to 10,000 square feet to 70.5% of buildings over 200,000 square feet (EIA 2018 CBECS microdata).[1]
- 60.1% of US commercial buildings, holding 80.9% of floorspace, had regularly scheduled HVAC maintenance in 2018 (EIA 2018 CBECS).[1][4]
- Space heating used 2,167 trillion Btu, cooling 589 trillion Btu and ventilation 728 trillion Btu in US commercial buildings in 2018 (EIA Table E1).[9]
- HVAC took 68.8% of major-fuel energy use in US public assembly buildings in 2018 and 22.7% in food sales buildings (EIA Table E1, our share).[9]
Calculations
Packaged share of air-conditioned floor area (signature)
Formulasum over buildings of FINALWT x SQFT x COOLP/100 x (PKGCP_EL / sum of all pct-cooled answers), divided by sum of FINALWT x SQFT x COOLP/100
Inputs: fact rows 11 (cooled area) and the microdata pct-cooled variables; derived d1, d2 (fact sheet rows)
Result: 51.7% of 68.3 billion cooled square feet, 35.3 billion square feet, 2018
Packaged units serve about half of US commercial cooled area, less than the 58.6% any-use floorspace figure suggests.
Limitations: Percent-cooled answers are respondent estimates; 697 records with overlapping systems were normalised to 100.
Packaged-main buildings with and without building automation
Formulasum FINALWT where MAINCL=2; same with EMCS=2
Inputs: derived d3, d4 (fact sheet rows)
Result: 2.40 million packaged-main buildings; 1.88 million without BAS (78.2%), 2018
The largest group of commercial buildings runs its main cooling without central controls.
Limitations: BAS presence is self-reported; RSE 5.1%.
Any-use versus served floorspace gap
Formula58.6% (PKGCL=1 floorspace share) minus packaged-served area / all floorspace
Inputs: derived d5 (fact sheet rows)
Result: 22.0 percentage points (packaged-served area 36.6% of all commercial floorspace), 2018
Quoting any-use floorspace as 'area cooled by rooftop units' overstates it.
Limitations: Different denominators: all floorspace versus cooled area.
Heated floor area by equipment
Formulaas d1 with HEATP and pct-heated variables
Inputs: derived d6 (fact sheet rows)
Result: Packaged 38.9%, boilers 24.6%, furnaces 11.6%, space heaters 7.1%, district 7.0%, heat pumps 7.0%, 2018
Boilers matter far more by area than by count.
Limitations: 1,677 records with overlapping heating systems normalised.
HVAC share of commercial energy use
Formula(space heating + cooling + ventilation) / total major fuels, Table E1
Inputs: derived d7, d8 (fact sheet rows)
Result: 51.3% of 6,787 trillion Btu in 2018; 68.8% in public assembly to 22.7% in food sales
HVAC is half of commercial energy use, more in buildings with little process load.
Limitations: EIA end-use figures are modeled, not metered.
Building automation by size
FormulaBAS share over 200,000 sq ft / BAS share 1,001 to 10,000 sq ft
Inputs: derived d10, table t4 (fact sheet rows)
Result: 70.5% / 10.0% = 7.0 times, 2018
Controls adoption rises steeply with building size.
Limitations: Small-building estimate RSE 9.9%.
Questions people ask
What percentage of commercial buildings use rooftop units?
In 2018, 43.3% of US commercial buildings used packaged units (the CBECS category for rooftop and slab-mounted units) for cooling, and 51.9% of cooled buildings had one as their main system. By area, packaged units served 51.7% of air-conditioned floor area (EIA 2018 CBECS microdata, our calculation).
How are commercial buildings heated?
In 2018, packaged units were the main heating equipment in 38.9% of heated US commercial buildings, furnaces in 27.9%, individual space heaters in 11.9%, boilers in 10.5% and heat pumps in 7.9%. By heated floor area, packaged units served 38.9% and boilers 24.6% (EIA 2018 CBECS microdata).
How much energy do commercial buildings use for HVAC?
US commercial buildings used 3,484 trillion Btu for space heating, cooling and ventilation in 2018, 51.3% of their 6,787 trillion Btu of major-fuel use, computed from EIA Table E1. Space heating alone was 2,167 trillion Btu.
Summary
- In 2018, packaged units served 51.7% of US commercial air-conditioned floor area, central chillers 19.0% and residential-type split systems 10.4% (EIA 2018 CBECS microdata, our allocation).
- In 2018, 2.40 million US commercial buildings, 51.9% of cooled buildings, named a packaged unit as their main cooling equipment (EIA 2018 CBECS microdata).
- In 2018, 78.2% of those packaged-main buildings, about 1.88 million, reported no building automation system (EIA 2018 CBECS microdata).
- In 2018, boilers were used in 11.9% of US commercial buildings but in buildings holding 29.7% of floorspace; furnaces were the reverse, 27.4% of buildings and 17.9% of floorspace (EIA 2018 CBECS).
- In 2018, packaged units served 85.1% of cooled floor area in US retail and mall buildings, against 31.9% in health care and 25.3% in lodging (EIA 2018 CBECS microdata).
- In 2018, heating, cooling and ventilation took 51.3% of US commercial major-fuel energy use, 3,484 trillion Btu (EIA 2018 CBECS Table E1).
- As of 2026-11-02, EIA has published no results from a CBECS later than 2018, so 2018 remains the newest national count of commercial HVAC equipment.
Frequently asked questions
How many commercial buildings are there in the US?
EIA estimated 5.9 million US commercial buildings with 96.4 billion square feet of floorspace in 2018 (2018 CBECS Table B1). The count excludes buildings of 1,000 square feet or less and manufacturing plants.
What share of commercial buildings have air conditioning?
78.2% of US commercial buildings were cooled in 2018, and 70.7% of all commercial floorspace was air-conditioned, 68.3 billion square feet (EIA 2018 CBECS microdata).
What is the most common commercial HVAC system?
The packaged unit. In 2018 it was the main cooling system in 51.9% of cooled US commercial buildings and the main heating system in 38.9% of heated buildings (EIA 2018 CBECS microdata).
How many commercial buildings use chillers?
Central chillers were used in 3.4% of US commercial buildings in 2018, about 165 thousand had one as the main cooling system, and chillers served 19.0% of air-conditioned floor area (EIA 2018 CBECS microdata).
How common are building automation systems in commercial buildings?
16.0% of US commercial buildings had a building automation system in 2018, holding 42.1% of floorspace. Adoption ran from 10.0% of buildings under 10,000 square feet to 70.5% over 200,000 square feet (EIA 2018 CBECS microdata).
Do commercial buildings use heat pumps?
11.4% of US commercial buildings used heat pumps for heating in 2018, and heat pumps served 7.0% of heated floor area. Of heat-pump buildings that answered, 54.7% reported a VRF system (EIA 2018 CBECS microdata).
How many commercial buildings have regular HVAC maintenance?
60.1% of US commercial buildings, holding 80.9% of floorspace, had regularly scheduled HVAC maintenance in 2018 (EIA 2018 CBECS). Among buildings over 200,000 square feet the share was 94.8%.
Which commercial buildings rely most on rooftop units?
Retail and mall buildings: packaged units served 85.1% of their cooled floor area in 2018. Food sales followed at 78.1% and warehouses at 74.7%; lodging was lowest at 25.3% (EIA 2018 CBECS microdata).
Is there newer data than the 2018 CBECS?
Not as of 2026-11-02. EIA's CBECS page lists no results from a later survey; its 2024 releases were exploratory web surveys of office and education buildings that EIA says do not represent all commercial buildings.
How much of commercial building energy goes to space heating?
Space heating used 2,167 trillion Btu in US commercial buildings in 2018, about 32% of end-use consumption by EIA's count, and 25.0 thousand Btu per square foot in buildings that heat with a major fuel (EIA Tables E1 and E2).
Download the data
Every table in this report is available as a CSV under CC BY 4.0. The fact sheet lists each value with its source URL and access date.
- derived_metrics.csv (CSV)
- fact_sheet.csv (CSV)
- Cooling equipment in US commercial buildings, 2018: three ways to count (CSV)
- Heating equipment in US commercial buildings, 2018 (CSV)
- Ranked: how much of each building type's cooled floor area runs on packaged units, 2018 (CSV)
- Controls and main cooling equipment by building size, 2018 (CSV)
- HVAC energy use by building activity, 2018 (ranked by HVAC share) (CSV)
- Equipment shares in the 2012 and 2018 CBECS (not a clean trend) (CSV)
For journalists and researchers
If you cite only a few, cite these
- Packaged units served 51.7% of US commercial air-conditioned floor area in 2018 (EIA 2018 CBECS microdata, HVAC Business Brokers Research Desk calculation).[1]
- 16.0% of US commercial buildings had a building automation system in 2018 (EIA 2018 CBECS microdata).[1]
- HVAC took 51.3% of US commercial building energy use in 2018 (EIA 2018 CBECS Table E1).[9]
Most quotable statistics
- Packaged units served 51.7% of US commercial air-conditioned floor area in 2018 (HVAC Business Brokers Research Desk analysis of EIA 2018 CBECS microdata).[1]
- 2.40 million US commercial buildings used a packaged unit as their main cooling system in 2018 (EIA 2018 CBECS microdata).[1]
- About 1.88 million US commercial buildings with packaged main cooling had no building automation system in 2018 (EIA 2018 CBECS microdata).[1]
- Central chillers were in 3.4% of US commercial buildings in 2018 but served 19.0% of their air-conditioned floor area (EIA 2018 CBECS microdata).[1]
- Heating, cooling and ventilation took 51.3% of US commercial building major-fuel energy use in 2018 (EIA 2018 CBECS Table E1).[9]
- Packaged units served 85.1% of cooled floor area in US retail buildings in 2018 (EIA 2018 CBECS microdata).[1]
Press summary
Packaged units served 51.7% of the air-conditioned floor area in US commercial buildings in 2018, according to an HVAC Business Brokers Research Desk analysis of the U.S. Energy Information Administration's 2018 Commercial Buildings Energy Consumption Survey microdata. About 2.40 million commercial buildings used a packaged unit as their main cooling system, and 78.2% of them, about 1.88 million, reported no building automation system. Heating, cooling and ventilation accounted for 51.3% of commercial building energy use in 2018, and the 2018 survey remains the latest EIA has published.
Suggested headlines
- Rooftop units cool half of US commercial air-conditioned floor space, federal survey data show
- 1.88 million US commercial buildings run rooftop units with no building automation
- Chillers sit in 3.4% of commercial buildings but cool 19.0% of their floor area
- HVAC takes 51.3% of US commercial building energy use
- Retail runs on rooftop units: 85.1% of cooled store space, 2018 data
How to cite this report
HVAC Business Brokers. (2026). Commercial HVAC Statistics: How US Commercial Buildings Heat and Cool (CBECS 2018). Retrieved from https://sell-my-hvac-business.com/research/commercial-building-hvac-statistics/
Reuse license
Data and tables are licensed CC BY 4.0. Attribution: “Source: HVAC Business Brokers, Commercial HVAC Statistics: How US Commercial Buildings Heat and Cool (CBECS 2018)” with a link to this page.
Reproduce this analysis
Every figure comes from the files below. The scripts that pulled and computed them are kept with the report and can be re-run.
| Dataset | Publisher | Source | Query or filter | Rows used | Retrieved |
|---|---|---|---|---|---|
| 2018 CBECS public use microdata (CSV) | U.S. Energy Information Administration | File or endpoint | All 6,436 records; FINALWT and FINALWT1 to FINALWT151; variables COOL, COOLP, HT1, HEATP, PKGCL, RCAC, ACWNWL, HTPMPC, CHILLR, EVAPCL, CHWT, PKGHT, FURNAC, SLFCON, BOILER, HTPMPH, REHEAT, STHW, MAINCL, MAINHT, pct-cooled and pct-heated variables, EMCS, EMCSCL, MAINT, ECN, VAV, DOAS, DCV, SMRTTHRM, PKGHPH, HPHVRF, YRCONC, RENOV, RENHVC, PBA, SQFT, SQFTC | 6,436 building records (5.9 million weighted buildings) | 2026-11-02 |
| 2018 CBECS Tables E1 and E2 (end-use consumption and intensity) | U.S. Energy Information Administration | File or endpoint | All buildings row and the 14 principal building activity rows; columns total, space heating, cooling, ventilation | 15 rows from each table | 2026-11-02 |
| 2018 CBECS Tables B1, B11, B21, B22 | U.S. Energy Information Administration | File or endpoint | All buildings totals (buildings, floorspace, buildings and floorspace using heating and cooling) | All-buildings row of each table | 2026-11-02 |
| 2012 CBECS Tables B38 to B41 (heating and cooling equipment) | U.S. Energy Information Administration | File or endpoint | All buildings row; packaged, furnace, boiler, heat pump and chiller columns | 1 row from each of 4 tables | 2026-11-02 |
Data quality and exclusions
- 456 records with no cooling (COOL not equal to 1) carry no cooling equipment answers and are excluded from cooling denominators; 429 unheated records are excluded from heating denominators.
- 697 cooling records and 1,677 heating records report percent-served answers that add to more than 100 (overlapping systems); each was scaled to 100 before allocating floor area.
- 243 records with no building automation answer are excluded from BAS denominators.
- Packaged heat pump question (PKGHPH): 369 records answered 'don't know'; the share is reported with that caveat and no count is published.
- Main cooling replaced since 2000 (NWMNCL) is missing for 1,617 of 4,331 pre-2000 cooled records, concentrated in packaged and heat pump buildings, so it was not used.
- Cells with an RSE above 50% or fewer than 20 sampled buildings are shown as Q, following EIA's withholding rule.
Methodology
Source selection: the only national, statistically sampled count of commercial building HVAC equipment is EIA's Commercial Buildings Energy Consumption Survey. We used the 2018 CBECS public use microdata (6,436 building records, revised December 2022), EIA's published Tables B1, B11, B21, B22, E1 and E2, and the 2012 CBECS Tables B38 to B41 for comparison. Every file was downloaded from eia.gov on 2026-11-02 and is saved unmodified in raw/.
Weighting and error: every estimate uses the final weight FINALWT. Relative standard errors come from the 151 jackknife replicate weights with the variance formula in EIA's microdata user's guide. Following EIA's rule, estimates with an RSE above 50% or fewer than 20 sampled buildings are shown as Q. Our any-use shares reproduce EIA's published 2018 highlights (packaged cooling 43% of buildings and 58% of floorspace; boilers 12% and 30%; regular maintenance 60% and 81%).
Served floor area (derived d1 and d6): cooled square feet = SQFT x COOLP/100; each building's cooled square feet are split across equipment in proportion to its percent-cooled answers, normalised to 100 where systems overlap. Heating uses HEATP and the percent-heated variables. Main equipment uses EIA's derived MAINCL and MAINHT. Energy shares use EIA's published Table E1 totals.
Conflicts: microdata floorspace totals differ from Table B1 by about 0.1% because EIA rounds square footage in the public file; we quote Table B1 for totals and the microdata for shares. 2012 and 2018 equipment shares are shown side by side but not trended, because EIA restructured the equipment questions in 2018.
Exclusions: the main-cooling-replaced variable (NWMNCL) and packaged heat pump counts were dropped for missingness and 'don't know' answers; see excluded.md. No market-research, trade-press or blog figures are used as data.
Last update 2026-11-02. Reproduce with python3 scripts/compute.py && python3 scripts/build_report.py && python3 scripts/compose_report.py.
This report presents published data with its limitations. It is not legal, financial or investment advice.
Sources, ranked by quality
Tier 1: primary and official sources (19)
- [1] U.S. Energy Information Administration. 2018 CBECS public use microdata file (CSV, 6,436 building records). 2018 (released Nov 2021, revised Dec 2022). Accessed 2026-11-02.
- [2] U.S. Energy Information Administration. 2018 CBECS microdata variable and response codebook. 2018. Accessed 2026-11-02.
- [3] U.S. Energy Information Administration. User's Guide to the 2018 CBECS Public Use Microdata File. 2018 (guide revised Jan 2023). Accessed 2026-11-02.
- [4] U.S. Energy Information Administration. 2018 CBECS Building Characteristics Highlights (flipbook). 2018. Accessed 2026-11-02.
- [5] U.S. Energy Information Administration. 2018 CBECS Table B1, summary table: floorspace, workers and hours. 2018 (released Sep 2021, revised Dec 2022). Accessed 2026-11-02.
- [6] U.S. Energy Information Administration. 2018 CBECS Table B11, principal building activity, number of buildings. 2018. Accessed 2026-11-02.
- [7] U.S. Energy Information Administration. 2018 CBECS Table B21, energy end uses, number of buildings. 2018. Accessed 2026-11-02.
- [8] U.S. Energy Information Administration. 2018 CBECS Table B22, energy end uses, floorspace. 2018. Accessed 2026-11-02.
- [9] U.S. Energy Information Administration. 2018 CBECS Table E1, major fuels consumption by end use. 2018 (released Dec 2022). Accessed 2026-11-02.
- [10] U.S. Energy Information Administration. 2018 CBECS Table E2, major fuels consumption intensities by end use. 2018 (released Dec 2022). Accessed 2026-11-02.
- [11] U.S. Energy Information Administration. 2018 CBECS Consumption and Expenditures Highlights (flipbook). 2018. Accessed 2026-11-02.
- [12] U.S. Energy Information Administration. 2012 CBECS Table B38, heating equipment, number of buildings. 2012 (released Apr 2015, revised May 2016). Accessed 2026-11-02.
- [13] U.S. Energy Information Administration. 2012 CBECS Table B39, heating equipment, floorspace. 2012. Accessed 2026-11-02.
- [14] U.S. Energy Information Administration. 2012 CBECS Table B40, cooling equipment, number of buildings. 2012 (revised Jan 2017). Accessed 2026-11-02.
- [15] U.S. Energy Information Administration. 2012 CBECS Table B41, cooling equipment, floorspace. 2012 (revised Jan 2017). Accessed 2026-11-02.
- [16] U.S. Energy Information Administration. Commercial Buildings Energy Consumption Survey (CBECS) home page and status notes. status notes to Dec 2024. Accessed 2026-11-02.
- [17] U.S. Energy Information Administration. 2018 CBECS Overview and Outline of Draft Questionnaire (May 2018). 2018 questionnaire. Accessed 2026-11-02.
- [18] U.S. Energy Information Administration. 2018 CBECS: What is an RSE? (relative standard errors). 2018. Accessed 2026-11-02.
- [19] U.S. Energy Information Administration. CBECS terminology. current. Accessed 2026-11-02.