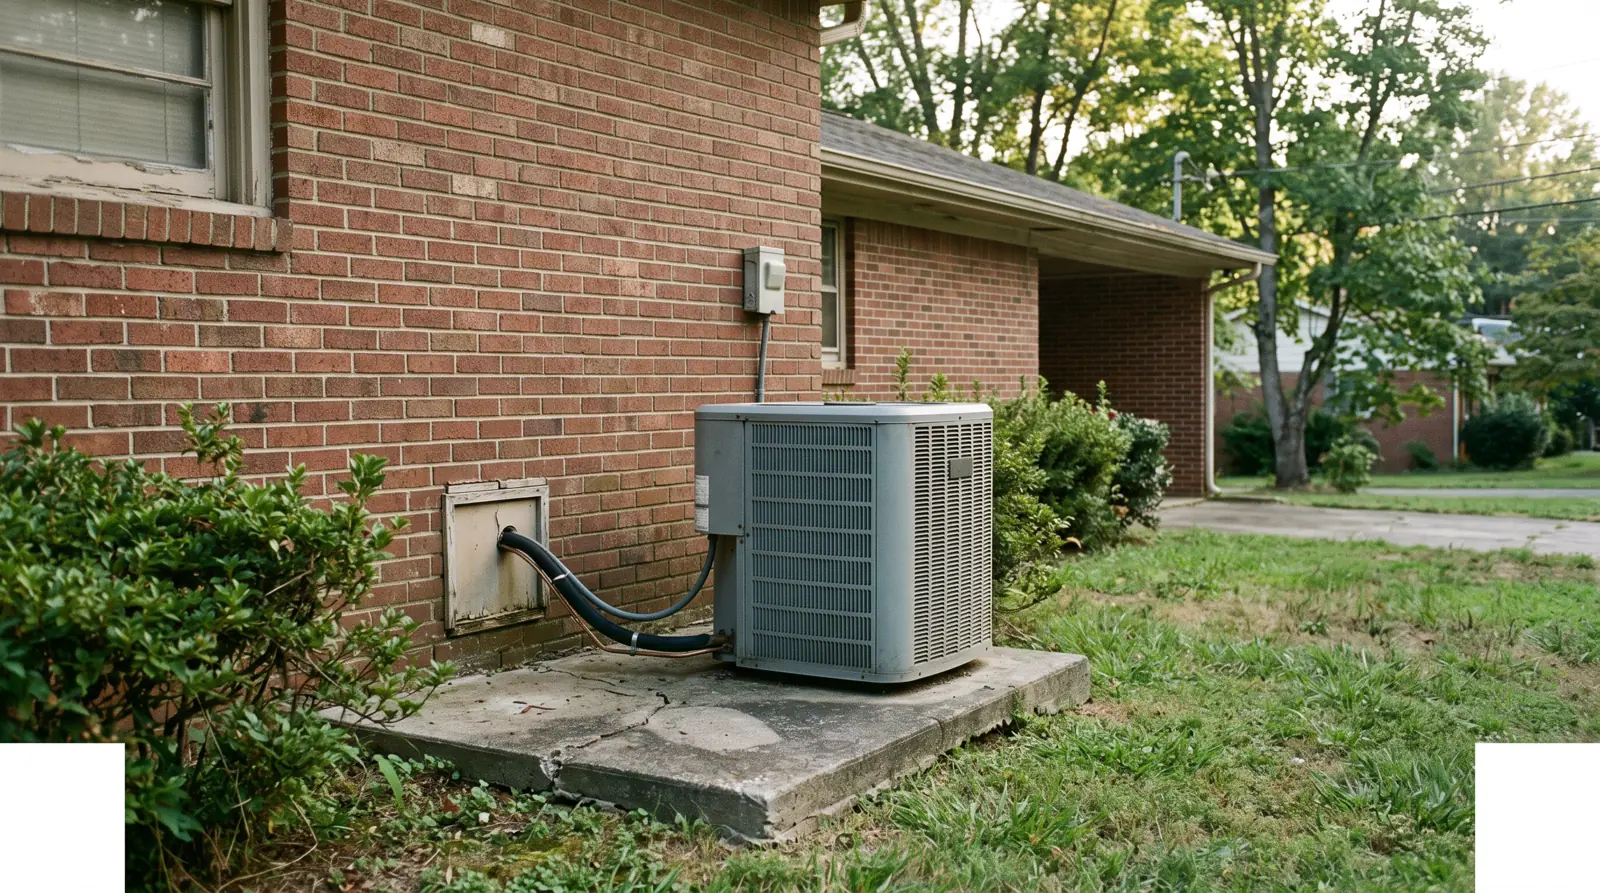
Heat Pump Sales vs Gas Furnaces: US Shipments From 2009 to August 2026
- Primary data
- AHRI monthly U.S. heating and cooling equipment shipment releases (central air conditioners, air-source heat pumps, gas and oil furnaces)
- Data period
- Annual 2009 to 2025; monthly January 2020 to August 2026
- Latest release used
- 2026-10-09
- Next release
- September 2026 data, due on AHRI's second-Friday schedule (13 November 2026)
- Geography
- United States (shipments); census divisions and regions (EIA RECS 2020, Census new housing 2025)
- Sources
- 34 (31 Tier 1)
US heat pump sales, counted as AHRI manufacturer shipments rather than installations, were 3,644,596 units in 2025: 11.6% below 2024 but 12.2% above gas furnaces (3,247,426). Heat pumps first outshipped gas furnaces in 2020, fell behind in 2021 and have led since 2022. From January to August 2026 they led 1.38 to 1.
Heat pump sales passed gas furnaces in 2020, slipped in 2021, and have led since 2022
Across 17 years of AHRI data, heat pumps went from 0.755 units per gas furnace in 2009 to a high of 1.321 in 2024. The crossover was not a clean line: 2020 was a narrow heat pump year and 2021 went back to furnaces.
In 2009, US manufacturers shipped 1,642,064 air-source heat pumps and 2,174,528 gas furnaces (AHRI December 2010 release). By 2025 the figures were 3,644,596 and 3,247,426 (AHRI December 2025 release).
Million units shipped by AHRI member manufacturers (not installations)
Source: AHRI December statistical releases 2010 to 2025; HVAC Business Brokers Research Desk compilation.
Heat pumps first outshipped gas furnaces in 2020, 3,418,478 to 3,351,176, a lead of 67,302 units. In 2021 gas furnace shipments jumped to 4,008,894, the highest in the series, and finished 92,128 units ahead of heat pumps (AHRI December 2023 release). Heat pumps have led every year since: 1.119 to 1 in 2022, 1.21 in 2023, 1.321 in 2024 and 1.122 in 2025.
Ratio above 1.0 means more heat pumps than gas furnaces
Source: AHRI December statistical releases; ratio calculated by HVAC Business Brokers Research Desk.
| Year | Air-source heat pumps | Gas furnaces | Central air conditioners | Oil furnaces | Heat pumps per gas furnace | Heat pump share of AC + HP (%) | Heat pump share of HP + gas + oil furnaces (%) | AHRI release used |
|---|---|---|---|---|---|---|---|---|
| 2009 | 1642064 | 2174528 | 3515648 | 55619 | 0.755 | 31.8 | 42.4 | doc_2010-12_0.pdf |
| 2010 | 1747920 | 2453279 | 3419290 | 56445 | 0.712 | 33.8 | 41.1 | doc_2011-12_0.pdf |
| 2011 | 1765002 | 2216160 | 3744691 | 48247 | 0.796 | 32.0 | 43.8 | doc_2012-12_0.pdf |
| 2012 | 1697796 | 2243397 | 3915869 | 35980 | 0.757 | 30.2 | 42.7 | doc_2013-12_0.pdf |
| 2013 | 1968632 | 2601760 | 4201068 | 32144 | 0.757 | 31.9 | 42.8 | doc_2014-12_0.pdf |
| 2014 | 2353990 | 2734713 | 4499660 | 34725 | 0.861 | 34.3 | 45.9 | doc_2015-12_0.pdf |
| 2015 | 2269462 | 2814203 | 4545855 | 39494 | 0.806 | 33.3 | 44.3 | doc_2016-12_0.pdf |
| 2016 | 2429867 | 2942545 | 4900992 | 37743 | 0.826 | 33.1 | 44.9 | doc_2017-12_0.pdf |
| 2017 | 2619782 | 3133768 | 5185747 | 37268 | 0.836 | 33.6 | 45.2 | doc_2018-12_0.pdf |
| 2018 | 2940502 | 3416571 | 5399760 | 38429 | 0.861 | 35.3 | 46.0 | doc_2019-12_0.pdf |
| 2019 | 3109840 | 3441872 | 5359775 | 40692 | 0.904 | 36.7 | 47.2 | doc_2021-12_0.pdf |
| 2020 | 3418478 | 3351176 | 5910284 | 36505 | 1.02 | 36.6 | 50.2 | doc_2022-12_0.pdf |
| 2021 | 3916766 | 4008894 | 6282285 | 39548 | 0.977 | 38.4 | 49.2 | doc_2023-12_0.pdf |
| 2022 | 4334479 | 3872368 | 6053575 | 29470 | 1.119 | 41.7 | 52.6 | doc_2023-12_0.pdf |
| 2023 | 3616632 | 2989516 | 5040042 | 22619 | 1.21 | 41.8 | 54.6 | doc_2025-12_0.pdf |
| 2024 | 4122004 | 3120677 | 5559766 | 30036 | 1.321 | 42.6 | 56.7 | doc_2025-12_0.pdf |
| 2025 | 3644596 | 3247426 | 4104933 | 32799 | 1.122 | 47.0 | 52.6 | doc_2025-12_0.pdf |
Units shipped by AHRI member manufacturers to US customers (not installations). Each year uses the most recent AHRI December release that reports it. Ratios and shares are our calculations.
Source: [10][11][12][13][14][15][16][17][18][9][7][8][6][1] AHRI; AHRI; AHRI; AHRI; AHRI; AHRI; AHRI; AHRI; AHRI; AHRI; AHRI; AHRI; AHRI; AHRI
What it means for an owner: heat pumps were 52.6% of heat pump plus gas and oil furnace shipments in 2025, so a heating offer built only around furnaces covers less than half of the heating equipment US manufacturers ship.
Why a January to August lead overstates the full year
Furnaces ship late in the year. Comparing heat pumps and furnaces on a year-to-date basis before December flatters heat pumps, by 0.119 ratio points in 2025 and 0.088 in 2024.
Seasonally matched ratio: Heat pumps shipped divided by gas furnaces shipped over the same calendar months in each year, here January to August, taken from one AHRI release so all three years carry the same revisions.
AHRI's August 2026 release reports January to August shipments for 2024, 2025 and 2026 side by side (AHRI August 2026 release). Heat pumps led gas furnaces 1.409 to 1 in those months of 2024, 1.241 to 1 in 2025 and 1.381 to 1 in 2026.
| Year | HP shipped Jan to Aug | Gas furnaces shipped Jan to Aug | Jan to Aug HP per gas furnace | Full-year HP per gas furnace | Jan to Aug ratio minus full-year ratio | Jan to Aug HP as % of full year | Jan to Aug gas furnaces as % of full year |
|---|---|---|---|---|---|---|---|
| 2024 | 2832062 | 2009468 | 1.409 | 1.321 | 0.088 | 68.7 | 64.4 |
| 2025 | 2751248 | 2216226 | 1.241 | 1.122 | 0.119 | 75.5 | 68.2 |
| 2026 | 2908644 | 2106454 | 1.381 | not yet reported |
Jan to Aug figures from AHRI's August 2026 release; full-year figures from the December 2025 release. 2026 full year not yet reported.
Set against full-year totals, the January to August ratio ran 0.088 above the final figure in 2024 and 0.119 above it in 2025. The reason is timing: 31.8% of 2025 gas furnace shipments came in September to December, against 24.5% of heat pump shipments. In 2024 the shares were 35.6% and 31.3%.
What it means for an owner: a mid-year headline that heat pumps lead by a wide margin will narrow by December. The 2026 Jan to Aug ratio of 1.381 sits between the 2024 and 2025 readings; we do not project a full-year figure from it.
Month by month since 2020, furnaces still win the late fall
Across 80 months from January 2020 to August 2026, gas furnaces outshipped heat pumps in 20 months, all of them between August and March. Heat pumps outshipped central air conditioners in 5 months, all in late 2025 and January 2026.
Ratio of units shipped in each month
Source: AHRI monthly statistical releases 2021 to 2026; ratio calculated by HVAC Business Brokers Research Desk.
The monthly heat pump to gas furnace ratio ranged from 0.686 in December 2020 to 1.686 in July 2024 (AHRI 2025 monthly releases). In 2025 the furnace months were September, October, November and December; in 2024 only December.
- September 2025: 265,689 heat pumps against 263,291 central air conditioners.
- October 2025: 209,883 against 202,990.
- November 2025: 198,247 against 181,223.
- December 2025: 219,529 against 188,715.
- January 2026: 229,957 against 210,862.
RMI's tracker reported heat pumps above one-way air conditioners in October, November and December 2025. The September 2025 and January 2026 margins in AHRI's releases are small and could reverse when AHRI revises those months.

Show all 32 rows
| Month | Air-source heat pumps | Central air conditioners | Gas furnaces | Heat pumps per gas furnace | Heat pumps above central ACs |
|---|---|---|---|---|---|
| 2024-01 | 231339 | 248035 | 216086 | 1.071 | no |
| 2024-02 | 284612 | 372897 | 214961 | 1.324 | no |
| 2024-03 | 367973 | 470653 | 248582 | 1.48 | no |
| 2024-04 | 314449 | 434239 | 234440 | 1.341 | no |
| 2024-05 | 365881 | 545636 | 245283 | 1.492 | no |
| 2024-06 | 432916 | 647901 | 303885 | 1.425 | no |
| 2024-07 | 430204 | 613216 | 255099 | 1.686 | no |
| 2024-08 | 404688 | 571153 | 291132 | 1.39 | no |
| 2024-09 | 383659 | 520197 | 302746 | 1.267 | no |
| 2024-10 | 365388 | 449972 | 280747 | 1.301 | no |
| 2024-11 | 315905 | 391531 | 260657 | 1.212 | no |
| 2024-12 | 224990 | 294336 | 267059 | 0.842 | no |
| 2025-01 | 275544 | 347357 | 271380 | 1.015 | no |
| 2025-02 | 293760 | 342542 | 259405 | 1.132 | no |
| 2025-03 | 382470 | 436291 | 298639 | 1.281 | no |
| 2025-04 | 374004 | 422275 | 264259 | 1.415 | no |
| 2025-05 | 387610 | 474519 | 283691 | 1.366 | no |
| 2025-06 | 363499 | 477270 | 278043 | 1.307 | no |
| 2025-07 | 351913 | 411530 | 260224 | 1.352 | no |
| 2025-08 | 322448 | 356930 | 300585 | 1.073 | no |
| 2025-09 | 265689 | 263291 | 281001 | 0.946 | yes |
| 2025-10 | 209883 | 202990 | 244324 | 0.859 | yes |
| 2025-11 | 198247 | 181223 | 238810 | 0.83 | yes |
| 2025-12 | 219529 | 188715 | 267065 | 0.822 | yes |
| 2026-01 | 229957 | 210862 | 217762 | 1.056 | yes |
| 2026-02 | 310696 | 328145 | 244774 | 1.269 | no |
| 2026-03 | 419917 | 436757 | 252982 | 1.66 | no |
| 2026-04 | 380888 | 456210 | 251401 | 1.515 | no |
| 2026-05 | 396553 | 523132 | 265734 | 1.492 | no |
| 2026-06 | 418538 | 605033 | 320281 | 1.307 | no |
| 2026-07 | 413679 | 503151 | 265810 | 1.556 | no |
| 2026-08 | 338416 | 418323 | 287710 | 1.176 | no |
Each month uses the latest AHRI release reporting it. Months from June 2026 on will be revised. Full January 2020 to August 2026 series: tables/monthly_2020_2026_full.csv.
What it means for an owner: heat pump volume now holds up into the shoulder months, which spreads installation work more evenly across the year than a furnace and straight-cool mix does.
Nearly half of the outdoor units shipped in 2025 were heat pumps
Within AHRI's central AC and heat pump category, the heat pump share rose from 31.8% in 2009 to 47.0% in 2025. Most of the 2025 jump came from air conditioners falling faster than heat pumps.
Percent of units shipped
Source: AHRI December statistical releases; share calculated by HVAC Business Brokers Research Desk.
In 2025 central air conditioner shipments fell 26.2% and heat pump shipments fell 11.6%, which lifted the heat pump share of the combined category from 42.6% in 2024 to 47.0%. For January to August 2026 the share was 45.5%, with air conditioners recovering faster (6.5%) than heat pumps (5.7%).
The category is mostly residential equipment: 96.5% of 2025 central AC and heat pump shipments were under 65,000 BTUH, AHRI's residential size line (AHRI December 2025 workbook). AHRI does not publish the size split for heat pumps alone.
What it means for an owner: the outdoor equipment a residential crew sets is close to an even split between heat pumps and straight-cool condensers nationally, so technician training and parts stock on reversing valves, defrost controls and heat pump charging now apply to nearly half of the work.
Only about one US home in seven heats mainly with a heat pump
EIA's RECS 2020 counted 17.19 million homes heated mainly by a central or ductless heat pump, 13.9% of 123.53 million. The South holds most of them.
Percent of occupied homes
Source: EIA, 2020 Residential Energy Consumption Survey, tables HC6.7 and HC6.8.
| Census division | All homes (million) | Main heat: central heat pump (million) | Main heat: ductless heat pump (million, Q = withheld) | Central heat pump share (%) | Any heat pump as main heat (%) | Main heat: central warm-air furnace, all fuels (million) | Furnace share (%) |
|---|---|---|---|---|---|---|---|
| Total U.S. | 123.53 | 16.13 | 1.06 | 13.1 | 13.9 | 74.42 | 60.2 |
| East South Central | 7.38 | 2.35 | Q | 31.8 | 31.8 | 3.94 | 53.4 |
| South Atlantic | 24.84 | 7.47 | 0.22 | 30.1 | 31.0 | 11.92 | 48.0 |
| West South Central | 14.62 | 2.7 | 0.11 | 18.5 | 19.2 | 8.94 | 61.1 |
| Mountain | 9.22 | 0.84 | 0.07 | 9.1 | 9.9 | 6.42 | 69.6 |
| West North Central | 8.5 | 0.46 | Q | 5.4 | 5.4 | 6.6 | 77.6 |
| Pacific | 18.51 | 0.89 | 0.29 | 4.8 | 6.4 | 10.53 | 56.9 |
| Middle Atlantic | 16.04 | 0.68 | 0.17 | 4.2 | 5.3 | 8.24 | 51.4 |
| East North Central | 18.55 | 0.63 | Q | 3.4 | 3.4 | 14.62 | 78.8 |
| New England | 5.88 | 0.1 | 0.08 | 1.7 | 3.1 | 3.22 | 54.8 |
EIA RECS 2020 (final release March 2023). Q = withheld by EIA; treated as zero in the any-heat-pump share, which is therefore a floor.
Source: [23][24] U.S. Energy Information Administration; U.S. Energy Information Administration
The South Atlantic (30.1%) and East South Central (31.8%) divisions have the highest central heat pump shares (EIA RECS 2020 HC6.8). New England (1.7%) and East North Central (3.4%) have the lowest, where central furnaces heat 78.8% of East North Central homes (EIA RECS 2020 HC6.7).
Shipments run well ahead of this installed base. In 2020, AHRI members shipped 3,418,478 heat pumps, or 19.9 for every 100 homes heated mainly by a heat pump. Gas furnace shipments that year were 6.3 per 100 homes heated mainly by a gas furnace. Heat pumps are going into many homes RECS does not count as heat pump homes: cooling replacements where a furnace still carries the heat, dual-fuel systems, new construction and light commercial jobs. This is a ratio of shipments to stock, not a replacement rate.

What it means for an owner: in most of the North and West, the service base an acquirer inherits is still furnace-heated; heat pump service revenue there is a newer and smaller book than the shipment headlines suggest.
New houses are near an even split, and the West moved fastest
In 2025, 483 thousand of 1005 thousand new single-family houses were completed with a heat pump and 490 thousand with a forced-air furnace. The West's heat pump share rose 25 points in five years.
Percent of new houses, by census region
Source: U.S. Census Bureau, Characteristics of New Housing (2025 data published 1 July 2026).
| Census region | New single-family homes with heat pump, 2020 (%) | New single-family homes with heat pump, 2025 (%) | Change (percentage points) | New homes with heat pump, 2025 (thousand) | New single-family homes completed, 2025 (thousand) | Existing homes heated mainly by central heat pump, RECS 2020 (%) | New-home share divided by installed share (times) |
|---|---|---|---|---|---|---|---|
| South | 59.0 | 63.0 | 4.0 | 370.0 | 584.0 | 26.7 | 2.4 |
| West | 17.0 | 42.0 | 25.0 | 95.0 | 224.0 | 6.3 | 6.7 |
| Northeast | 11.0 | 14.0 | 3.0 | 9.0 | 66.0 | 3.6 | 3.9 |
| Midwest | 10.0 | 7.0 | -3.0 | 9.0 | 131.0 | 4.0 | 1.8 |
| United States | 39.0 | 48.0 | 9.0 | 483.0 | 1005.0 | 13.1 | 3.7 |
Census Characteristics of New Housing (2025 data published 1 July 2026; air-source and ground-source combined) and EIA RECS 2020 region totals. Last column is our calculation.
Source: [29][23][24] U.S. Census Bureau; U.S. Energy Information Administration; U.S. Energy Information Administration
Census data on new single-family houses completed (Characteristics of New Housing) show the heat pump share at 63% in the South, 42% in the West, 14% in the Northeast and 7% in the Midwest in 2025. The Midwest share fell from 10% in 2020.
Our second derived measure divides the 2025 new-home heat pump share by the 2020 share of existing homes heated mainly by a central heat pump. In the West new houses are 6.7 times as likely to get a heat pump as the existing stock is to have one as main heat; in the South the multiple is 2.4, in the Northeast 3.9 and in the Midwest 1.8.
What it means for an owner: in the West, the newest homes in a service area are where heat pump maintenance agreements will come from; in the Midwest, new construction has not moved toward heat pumps.
Mobile homes and newer houses lean heat pump, pre-1950 houses do not
Heat pump main heat ranged from 4.2% of homes built before 1950 to 20.8% of homes built from 2016 to 2020 (RECS 2020).
| Cut | Group | All homes (million) | Main heat: central heat pump (million) | Central heat pump share (%) | Central warm-air furnace share (%) |
|---|---|---|---|---|---|
| Housing type | Single-family detached | 77.07 | 10.01 | 13.0 | 68.8 |
| Housing type | Single-family attached | 7.45 | 0.75 | 10.1 | 65.9 |
| Housing type | Apartments (2 to 4 units) | 9.34 | 0.92 | 9.9 | 45.2 |
| Housing type | Apartments (5 or more units) | 22.84 | 2.87 | 12.6 | 37.9 |
| Housing type | Mobile home | 6.83 | 1.58 | 23.1 | 52.7 |
| Year built | Before 1950 | 20.26 | 0.85 | 4.2 | 58.5 |
| Year built | 1950 to 1959 | 12.48 | 0.91 | 7.3 | 66.4 |
| Year built | 1960 to 1969 | 12.76 | 1.27 | 10.0 | 59.6 |
| Year built | 1970 to 1979 | 18.34 | 2.47 | 13.5 | 57.0 |
| Year built | 1980 to 1989 | 16.3 | 2.8 | 17.2 | 55.2 |
| Year built | 1990 to 1999 | 17.16 | 3.08 | 17.9 | 62.2 |
| Year built | 2000 to 2009 | 16.16 | 2.78 | 17.2 | 64.4 |
| Year built | 2010 to 2015 | 5.53 | 1.03 | 18.6 | 61.8 |
| Year built | 2016 to 2020 | 4.56 | 0.95 | 20.8 | 60.1 |
EIA RECS 2020 tables HC6.1 and HC6.3. Shares are our calculations from published counts.
Source: [25][26] U.S. Energy Information Administration; U.S. Energy Information Administration
By housing type, mobile homes had the highest central heat pump share in 2020 at 23.1%, followed by single-family detached houses at 13.0% and apartments in buildings of five or more units at 12.6% (EIA RECS 2020 HC6.1). By age, every decade from the 1980s on sits between 17.2% and 20.8% (EIA RECS 2020 HC6.3).
What it means for an owner: the age and type of the housing in a territory predicts the equipment mix on service calls better than national shipment totals do.
What a shipment count can and cannot tell an HVAC owner
AHRI counts units that change ownership from member manufacturers to US customers. It is the best free national series, with known gaps.
Shipment: A unit whose ownership transfers from the manufacturer; consignments are excluded (AHRI FAQ). A shipment can sit in distributor stock for months before it is installed.
- Ductless included: AHRI's 2026 product definitions place ducted and non-ducted (ductless) split systems inside the central AC and air-source heat pump categories; window and wall units are excluded.
- Commercial units included: the category runs to rooftop sizes above 65,000 BTUH, which made up the remaining share beyond the 96.5% residential-size portion in 2025.
- Revisions: AHRI restates prior months; this report uses the latest release that reports each figure, and the monthly values sum exactly to AHRI's December totals for 2020 to 2025.
- Coverage: AHRI members make more than 90 percent of North American equipment of these kinds, but AHRI does not publish what share its statistics program captures.
- No state data: AHRI states that state or regional shipment data are not public, so regional comparisons here rely on EIA and Census housing data.
Ratios behind the comparison
Heat pumps shipped per gas furnace shipped, by year
Formulahp_shipments(year) / gas_furnace_shipments(year)
Inputs: fact_sheet rows 1 to 68 (annual AHRI December YTD values, 2009 to 2025) (fact sheet rows)
Result: 0.755 in 2009; 1.02 in 2020; 0.977 in 2021; 1.321 in 2024; 1.122 in 2025
First crossover in 2020, reversal in 2021, heat pump lead every year from 2022.
Limitations: Shipments, not installations; heat pumps also replace cooling-only equipment in furnace homes.
Seasonally matched January to August ratio (signature)
Formulahp_jan_to_aug(year) / gas_jan_to_aug(year), all from AHRI's August 2026 release; gap = Jan to Aug ratio minus full-year ratio
Inputs: fact_sheet rows 61, 62, 65, 66, 69, 70, 73, 74, 77, 78 (fact sheet rows)
Result: 1.409 (2024), 1.241 (2025), 1.381 (2026); gap 0.088 in 2024 and 0.119 in 2025
Year-to-date comparisons before December overstate the heat pump lead because furnaces ship late in the year.
Limitations: Two years of gap history; the Jan to Aug figures come from a later release than the December totals, so revisions may differ slightly.
Share of annual shipments made September to December
Formula(full_year - jan_to_aug) / full_year x 100
Inputs: fact_sheet rows 62, 66, 70, 74 (gas); 61, 65, 69, 73 (heat pumps) (fact sheet rows)
Result: Gas furnaces 31.8% and heat pumps 24.5% in 2025; 35.6% and 31.3% in 2024
Explains the gap in d2.
Limitations: Mixed release vintages.
Months in which heat pumps outshipped central air conditioners
Formulacount(month) where hp > ac, January 2020 to August 2026
Inputs: tables/monthly_2020_2026_full.csv (80 months) (fact sheet rows)
Result: 5 months: September 2025 to January 2026
A first in the six-plus years of monthly data compiled here.
Limitations: September 2025 and January 2026 margins are small and subject to revision.
New-home heat pump share divided by installed-base share (signature 2)
FormulaCensus 2025 new single-family heat pump share / RECS 2020 share of homes heated mainly by a central heat pump, by census region
Inputs: fact_sheet Census rows for 2025 and RECS region rows (see derived_metrics d_gap_*) (fact sheet rows)
Result: West 6.7x, Northeast 3.9x, South 2.4x, Midwest 1.8x, US 3.7x
Shows where new construction is changing the regional equipment base fastest.
Limitations: Different years and universes (new single-family houses vs all occupied homes); Census counts air-source and ground-source units together.
Shipments per 100 homes using that equipment as main heat, 2020
FormulaAHRI 2020 shipments / RECS 2020 homes x 100
Inputs: fact_sheet rows 45, 46 and RECS US rows (fact sheet rows)
Result: Heat pumps 19.9; gas furnaces 6.3
Heat pumps reach far more homes than the count of heat pump heated homes implies.
Limitations: Not a replacement rate; shipments include new construction, cooling-only replacements and commercial units.
Heat pump share of central AC plus heat pump shipments
Formulahp / (hp + ac) x 100
Inputs: fact_sheet rows 1 to 68 and 77, 79 (fact sheet rows)
Result: 31.8% (2009), 42.6% (2024), 47.0% (2025), 45.5% (Jan to Aug 2026)
Close to an even split in outdoor equipment.
Limitations: Includes commercial sizes.
Where the numbers diverge
- US air-source heat pump shipments were 3,644,596 units in 2025, down 11.6% from 4,122,004 in 2024 (AHRI, units shipped).[1]
- US gas furnace shipments rose 4.1% to 3,247,426 units in 2025.[1]
- US central air conditioner shipments fell 26.2% to 4,104,933 units in 2025.[1]
- Heat pumps outshipped gas furnaces by 397,170 units in 2025, a 12.2% lead.[1]
- The first year in the 2009 to 2025 AHRI series in which heat pumps outshipped gas furnaces was 2020, by 67,302 units.[7][8]
- Gas furnaces outshipped heat pumps in 2021 by 92,128 units (4,008,894 against 3,916,766).[6]
- The heat pump to gas furnace ratio rose from 0.755 in 2009 to a peak of 1.321 in 2024, then fell to 1.122 in 2025.[10][1]
- Heat pump shipments peaked in 2022 at 4,334,479 units; 2025 was 15.9% below that peak.[6][1]
- From 2009 to 2025, annual US heat pump shipments grew 122.0% and gas furnace shipments grew 49.3%.[10][1]
- January to August 2026: 2,908,644 heat pumps and 2,106,454 gas furnaces shipped, a ratio of 1.381.[2]
- Heat pumps were 47.0% of central AC plus heat pump shipments in 2025, up from 31.8% in 2009.[1][10]
- In 2020, 13.1% of US homes (16.13 million of 123.53 million) heated mainly with a central heat pump, and 1.06 million more with a ductless heat pump (EIA RECS 2020).[23]
- In the South Atlantic division, 30.1% of homes heated mainly with a central heat pump in 2020; in East North Central the figure was 3.4%.[23][24]
- The share of new single-family houses in the West completed with a heat pump rose from 17% in 2020 to 42% in 2025 (Census).[29]
- 23.1% of mobile homes heated mainly with a central heat pump in 2020, against 13.0% of single-family detached houses.[25]
Summary
- US manufacturers shipped 3,644,596 air-source heat pumps in 2025, against 3,247,426 gas furnaces and 4,104,933 central air conditioners (AHRI, December 2025 release).
- Heat pumps first outshipped gas furnaces in 2020 (1.02 to 1), dropped back below in 2021 (0.977 to 1), and have led every year from 2022 to 2025; the ratio peaked at 1.321 in 2024.
- Our signature measure: a January to August comparison flatters heat pumps. In 2025 the Jan to Aug ratio was 1.241 but the full-year ratio was 1.122, because 31.8% of 2025 gas furnaces shipped in September to December against 24.5% of heat pumps.
- Through August 2026, heat pump shipments were up 5.7% on the same months of 2025 and gas furnaces were down 5.0%, putting the Jan to Aug ratio at 1.381.
- Heat pumps outshipped central air conditioners for 5 straight months, September 2025 to January 2026, the only such months in our 80-month series.
- Only 13.9% of US homes heated mainly with a central or ductless heat pump in 2020 (EIA RECS), from 31.8% in the East South Central division to 1.7% (central units) in New England.
- In new construction the split is nearly even: 48% of new single-family houses completed in 2025 had a heat pump and 49% a forced-air furnace (Census).
Questions people ask
Are heat pumps outselling furnaces?
Yes on AHRI's shipment count, every year from 2022 to 2025. In 2025 US manufacturers shipped 3,644,596 air-source heat pumps and 3,247,426 gas furnaces, a ratio of 1.122 to 1. Heat pumps also led narrowly in 2020; gas furnaces led in 2021.
How many heat pumps were sold in 2025?
AHRI reported 3,644,596 air-source heat pumps shipped in the US in 2025. That is a shipment count from member manufacturers, not a count of installations or retail sales.
Which regions use the most heat pumps?
The South. In EIA's RECS 2020, 31.8% of East South Central homes and 30.1% of South Atlantic homes heated mainly with a central heat pump, against 1.7% in New England. In new construction, 63% of 2025 Southern single-family houses got a heat pump.
Did heat pump sales drop in 2025 or 2026?
They dropped in 2025: AHRI reported heat pump shipments down 11.6% from 2024. Through August 2026 they were up 5.7% on the same months of 2025, while gas furnaces were down 5.0%. AHRI does not give reasons in its releases.
What share of US homes have a heat pump?
In 2020, 13.9% of US homes (17.19 million) used a central or ductless heat pump as their main heating equipment (EIA RECS 2020). RECS tables do not publish the number of homes that have a heat pump used only for cooling or as secondary heat, so the share owning any heat pump is higher.
For journalists and researchers
If you cite only a few, cite these
- US air-source heat pump shipments: 3,644,596 in 2025, 1.122 per gas furnace (AHRI).[1]
- January to August 2026 heat pump to gas furnace ratio: 1.381, against a 2025 full-year ratio of 1.122 (AHRI, our calculation).[2][1]
- West new-home heat pump share of 42% in 2025 is 6.7 times the region's 2020 installed share of 6.3% (Census, EIA, our calculation).[29][24]
Most quotable statistics
- US manufacturers shipped 3,644,596 air-source heat pumps in 2025, 11.6% fewer than in 2024 (AHRI).[1]
- Heat pumps outshipped gas furnaces 1.122 to 1 in the US in 2025, down from 1.321 to 1 in 2024 (AHRI data).[1]
- Gas furnaces outshipped heat pumps in the US in 2021 by 92,128 units; heat pumps have led every year since (AHRI data).[6][1]
- From January to August 2026, US heat pump shipments ran 1.381 per gas furnace, against 1.241 in the same months of 2025 (AHRI data, our calculation).[2]
- In 2025, 31.8% of US gas furnace shipments came in September to December, against 24.5% of heat pump shipments (AHRI data, our calculation).[1][2]
- 42% of new single-family houses completed in the West in 2025 had a heat pump, up from 17% in 2020 (Census).[29]
- 13.9% of US homes heated mainly with a heat pump in 2020 (EIA RECS 2020).[23]
Press summary
US manufacturers shipped 3,644,596 air-source heat pumps in 2025, down 11.6% from 2024 but 12.2% ahead of gas furnaces at 3,247,426, according to a HVAC Business Brokers Research Desk compilation of AHRI shipment releases from 2009 to August 2026. Heat pumps first outshipped gas furnaces in 2020, lost the lead in 2021 and have led since 2022, with the ratio peaking at 1.321 in 2024. Through August 2026 heat pump shipments were up 5.7% and gas furnaces down 5.0%. The analysis finds that year-to-date comparisons overstate the heat pump lead: in 2025 the January to August ratio was 1.241 but the full-year figure was 1.122, because furnaces ship late in the year. Installed heat pumps lag shipments: 13.9% of US homes heated mainly with one in 2020 (EIA). In the West, 42% of new houses got a heat pump in 2025. All AHRI figures are units shipped, not installed.
Suggested headlines
- Heat pumps outshipped gas furnaces 1.122 to 1 in 2025, AHRI data show
- Heat pump shipments fell 11.6% in 2025 but still beat gas furnaces
- Year-to-date heat pump leads shrink by December: 2025 ratio fell from 1.241 to 1.122
- 42% of new Western homes now get a heat pump, up from 17% in 2020
- Only 13.9% of US homes heat mainly with a heat pump despite years of strong shipments
How to cite this report
HVAC Business Brokers. (2026). Heat Pump Sales vs Gas Furnaces: US Shipments From 2009 to August 2026. Retrieved from https://sell-my-hvac-business.com/research/heat-pump-sales/
Reuse license
Data and tables are licensed CC BY 4.0. Attribution: “Source: HVAC Business Brokers, Heat Pump Sales vs Gas Furnaces: US Shipments From 2009 to August 2026” with a link to this page.
Download the data
Every table in this report is available as a CSV under CC BY 4.0. The fact sheet lists each value with its source URL and access date.
Frequently asked questions
How many heat pumps were shipped in the US in 2024?
4,122,004, according to AHRI's December 2025 release. That was 32.1% more than gas furnaces that year.
What was the peak year for US heat pump shipments?
2022, with 4,334,479 units in the AHRI series from 2009 to 2025. 2025 shipments were 15.9% below that peak.
How many gas furnaces were shipped in 2025?
3,247,426, up 4.1% from 3,120,677 in 2024 (AHRI). The series high was 4,008,894 in 2021.
How many central air conditioners were shipped in 2025?
4,104,933, down 26.2% from 5,559,766 in 2024 (AHRI).
Do AHRI heat pump numbers include ductless mini-splits?
AHRI's 2026 product definitions say the central AC and air-source heat pump categories include ducted and non-ducted split systems. Window and wall room units are excluded. AHRI does not report ductless units separately.
Are AHRI shipments the same as installations?
No. AHRI counts a shipment when ownership transfers from the manufacturer, so units can sit in distributor inventory before installation. Shipments also include some light commercial units.
How much have heat pump shipments grown since 2009?
Annual heat pump shipments grew 122.0% from 2009 (1,642,064) to 2025 (3,644,596). Gas furnace shipments grew 49.3% and central AC shipments 16.8% over the same years.
Are new homes built with heat pumps or furnaces?
Almost evenly. In 2025, 483 thousand new single-family houses (about 48%) were completed with a heat pump and 490 thousand (49%) with a forced-air furnace, per the Census Bureau.
Does AHRI publish heat pump shipments by state?
No. AHRI states that state and regional shipment data are not available to the public. Regional patterns have to come from housing surveys such as EIA RECS and Census new-housing data.
When is the next AHRI shipment release?
AHRI aims to publish on the second Friday of each month for shipments two months earlier, so September 2026 figures are due on 13 November 2026. The latest release, for August 2026, came out on 9 October 2026.
Reproduce this analysis
Every figure comes from the files below. The scripts that pulled and computed them are kept with the report and can be re-run.
| Dataset | Publisher | Source | Query or filter | Rows used | Retrieved |
|---|---|---|---|---|---|
| AHRI December statistical releases 2010 to 2025 | AHRI | File or endpoint | December release for each year; YTD rows for gas warm-air furnaces, oil warm-air furnaces, air conditioners only, heat pumps only (sentences in 2010 to 2018, tables from 2019) | 15 December release PDFs (2010 to 2023 and 2025); 17 annual years x 4 products = 68 values | 2026-11-02 |
| AHRI monthly statistical releases 2021, 2023, 2025, 2026 | AHRI | File or endpoint | Monthly releases Jan to Nov 2021, Jan to Nov 2023, Jan to Nov 2025, Jan to Aug 2026; month and prior-year month for 4 products; files in raw/ahri | 80 months x 4 products (January 2020 to August 2026) | 2026-11-02 |
| AHRI December 2025 Numbers workbook | AHRI | File or endpoint | Unitary AC and HP size bins, year to date | 21 size bins; 8 bins under 65,000 BTUH summed | 2026-11-02 |
| EIA RECS 2020 housing characteristics tables HC6.1, HC6.3, HC6.7, HC6.8, HC7.1 | U.S. Energy Information Administration | File or endpoint | Rows: All homes; Main heating equipment (including all fuels): Heat pump, Ductless heat pump, Central warm-air furnace; Natural gas central warm-air furnace | 10 geography columns, 5 housing types, 9 vintages | 2026-11-02 |
| Census Characteristics of New Housing, type of heating system, new single-family houses completed | U.S. Census Bureau | File or endpoint | Sheet SFTotalHeatSystem; United States and four regions; years 2010 to 2025; heat pump and forced-air furnace counts and percents | 5 geographies x 8 years | 2026-11-02 |
Data quality and exclusions
- 60 AHRI release PDFs parsed (text extraction with pdftotext): 29 fetched directly from AHRI and 31 as Internet Archive copies of official AHRI URLs that block automated clients.
- 1 file (December 2024 release, Word format) was downloaded but not parsed: every figure it holds is restated in the December 2025 release, which we used instead.
- 0 of 320 monthly cells (80 months x 4 products) had to be derived from year-to-date differences; all were stated directly in a release.
- Monthly heat pump, central AC and gas furnace values for each year 2020 to 2025 sum exactly to AHRI's December year-to-date totals (6 of 6 years reconcile).
- 3 RECS 2020 ductless heat pump cells (East South Central, West North Central, East North Central) are withheld by EIA (Q); they are treated as zero in the any-heat-pump share, which is therefore a floor.
- Census cells marked (Z) or (S) were not used. The source's standard errors for the regional heat pump percentages run from 2 percentage points (Midwest) to 9 (West), so the West multiple in t5 is the least precise.
Methodology
Source selection: the shipment series comes only from AHRI's free monthly statistical releases, the industry body's own publication. Installed-base and new-construction figures come from EIA's 2020 Residential Energy Consumption Survey and the Census Bureau's Characteristics of New Housing. Trade press and advocacy trackers are cited only to compare claims.
Access: AHRI release files on ahrinet.org/sites/default/files were downloaded directly. Files on ahrinet.org/system/files sit behind a browser challenge for automated clients; we did not bypass it and instead used Internet Archive captures of the same official URLs (HTTP 200, PDF), labelled as such in the source list and logged with capture timestamps in raw/ahri/file_manifest.json.
Revisions and conflicts: AHRI restates earlier months. Every annual and monthly value uses the most recent AHRI release that reports it (a release reports the current month, the same month a year earlier, and year-to-date totals for up to three years). Annual totals are December year-to-date figures, which AHRI states equal the calendar year. Monthly values for 2020 to 2025 sum exactly to the December totals.
Derived metrics: ratios, shares, gaps and multiples are computed in scripts/07_build_tables.py and listed with formulas and fact-sheet row numbers in derived_metrics.csv. The seasonally matched ratio uses January to August figures for three years from a single release (August 2026) so all three carry the same revisions.
Limitations: shipments are not installations; AHRI does not publish state data or heat pump size splits; the AHRI category includes some light commercial units and, per AHRI's 2026 definitions, ductless systems; RECS 2020 predates the 2022 to 2025 shipment years; Census counts air-source and ground-source heat pumps together.
Last updated 2 November 2026 using AHRI's August 2026 release (published 9 October 2026). This report is part of the research library of HVAC Business Brokers.
This report presents published data with its limitations. It is not legal, financial or investment advice.
Sources, ranked by quality
Tier 1: primary and official sources (31)
- [1] AHRI. AHRI Releases December 2025 U.S. Heating and Cooling Equipment Shipment Data (released 2026-02-13). 2023 to 2025 full years. Accessed 2026-11-02.
- [2] AHRI. AHRI Releases August 2026 U.S. Heating and Cooling Equipment Shipment Data (released 2026-10-09). January to August 2024, 2025, 2026. Accessed 2026-11-02.
- [3] AHRI. Monthly Shipments (release index and schedule). 2010 to 2026 release list. Accessed 2026-11-02.
- [4] AHRI. Product Definitions and FAQs: U.S. Heating and Cooling Equipment Shipment Data. definitions as of 2026. Accessed 2026-11-02.
- [5] AHRI. December 2025 Numbers (public Excel workbook). 2025. Accessed 2026-11-02.
- [6] AHRI. AHRI December 2023 Statistical Release (Internet Archive copy of the official AHRI file). 2021 to 2023 full years. Accessed 2026-11-02.
- [7] AHRI. AHRI December 2021 Statistical Release. 2019 to 2021 full years. Accessed 2026-11-02.
- [8] AHRI. AHRI December 2022 Statistical Release (Internet Archive copy of the official AHRI file). 2020 to 2022 full years. Accessed 2026-11-02.
- [9] AHRI. AHRI December 2019 Statistical Release (Internet Archive copy of the official AHRI file). 2018 and 2019 full years. Accessed 2026-11-02.
- [10] AHRI. AHRI December 2010 Statistical Release (Internet Archive copy of the official AHRI file). 2009 and 2010 full years. Accessed 2026-11-02.
- [11] AHRI. AHRI December 2011 Statistical Release (Internet Archive copy of the official AHRI file). 2010 and 2011 full years. Accessed 2026-11-02.
- [12] AHRI. AHRI December 2012 Statistical Release (Internet Archive copy of the official AHRI file). 2011 and 2012 full years. Accessed 2026-11-02.
- [13] AHRI. AHRI December 2013 Statistical Release (Internet Archive copy of the official AHRI file). 2012 and 2013 full years. Accessed 2026-11-02.
- [14] AHRI. AHRI December 2014 Statistical Release (Internet Archive copy of the official AHRI file). 2013 and 2014 full years. Accessed 2026-11-02.
- [15] AHRI. AHRI December 2015 Statistical Release (Internet Archive copy of the official AHRI file). 2014 and 2015 full years. Accessed 2026-11-02.
- [16] AHRI. AHRI December 2016 Statistical Release (Internet Archive copy of the official AHRI file). 2015 and 2016 full years. Accessed 2026-11-02.
- [17] AHRI. AHRI December 2017 Statistical Release (Internet Archive copy of the official AHRI file). 2016 and 2017 full years. Accessed 2026-11-02.
- [18] AHRI. AHRI December 2018 Statistical Release (Internet Archive copy of the official AHRI file). 2017 and 2018 full years. Accessed 2026-11-02.
- [19] AHRI. AHRI monthly statistical releases, January to November 2021 (11 PDFs, file list in repro). monthly 2020 and 2021. Accessed 2026-11-02.
- [20] AHRI. AHRI monthly statistical releases, January to November 2023 (Internet Archive copies, file list in repro). monthly 2022 and 2023. Accessed 2026-11-02.
- [21] AHRI. AHRI monthly statistical releases, January to November 2025 (public files and Internet Archive copies, file list in repro). monthly 2024 and 2025. Accessed 2026-11-02.
- [22] AHRI. AHRI monthly statistical releases, January to July 2026 (7 PDFs, file list in repro). monthly 2025 and 2026. Accessed 2026-11-02.
- [23] U.S. Energy Information Administration. RECS 2020 Table HC6.7: Space heating in homes in the Northeast and Midwest regions (final release March 2023). 2020. Accessed 2026-11-02.
- [24] U.S. Energy Information Administration. RECS 2020 Table HC6.8: Space heating in homes in the South and West regions (final release March 2023). 2020. Accessed 2026-11-02.
- [25] U.S. Energy Information Administration. RECS 2020 Table HC6.1: Space heating in U.S. homes, by housing unit type. 2020. Accessed 2026-11-02.
- [26] U.S. Energy Information Administration. RECS 2020 Table HC6.3: Space heating in U.S. homes, by year of construction. 2020. Accessed 2026-11-02.
- [27] U.S. Energy Information Administration. RECS 2020 Table HC7.1: Air conditioning in U.S. homes, by housing unit type. 2020. Accessed 2026-11-02.
- [28] U.S. Energy Information Administration. 2024 Residential Energy Consumption Survey data page (space heating tables scheduled for spring 2027). 2024 survey. Accessed 2026-11-02.
- [29] U.S. Census Bureau. Characteristics of New Housing: Type of Heating System Used in New Single-Family Houses Completed. 1973 to 2025. Accessed 2026-11-02.
- [30] U.S. Census Bureau. Characteristics of New Housing: Current Data (2025 annual data published 2026-07-01). 2025. Accessed 2026-11-02.
- [31] eCFR, Office of the Federal Register. 40 CFR 84.54 Restrictions on the use of hydrofluorocarbons (eCFR, current through 2026-10-29). rule text as of 2026-10-29. Accessed 2026-11-02.
Tier 2: trade bodies, market research, company data (1)
- [32] RMI. Tracking the Heat Pump and Water Heater Market in the United States. May 2025 to June 2026. Accessed 2026-11-02.
Tier 3: journalism and expert commentary (2)
- [33] Canary Media. Heat pump sales dipped in 2025. They still beat gas furnaces.. 2025. Accessed 2026-11-02.
- [34] ACHR News. Heat Pump, A/C Shipments See 20% Declines in 2025 (2026-02-25). 2025. Accessed 2026-11-02.