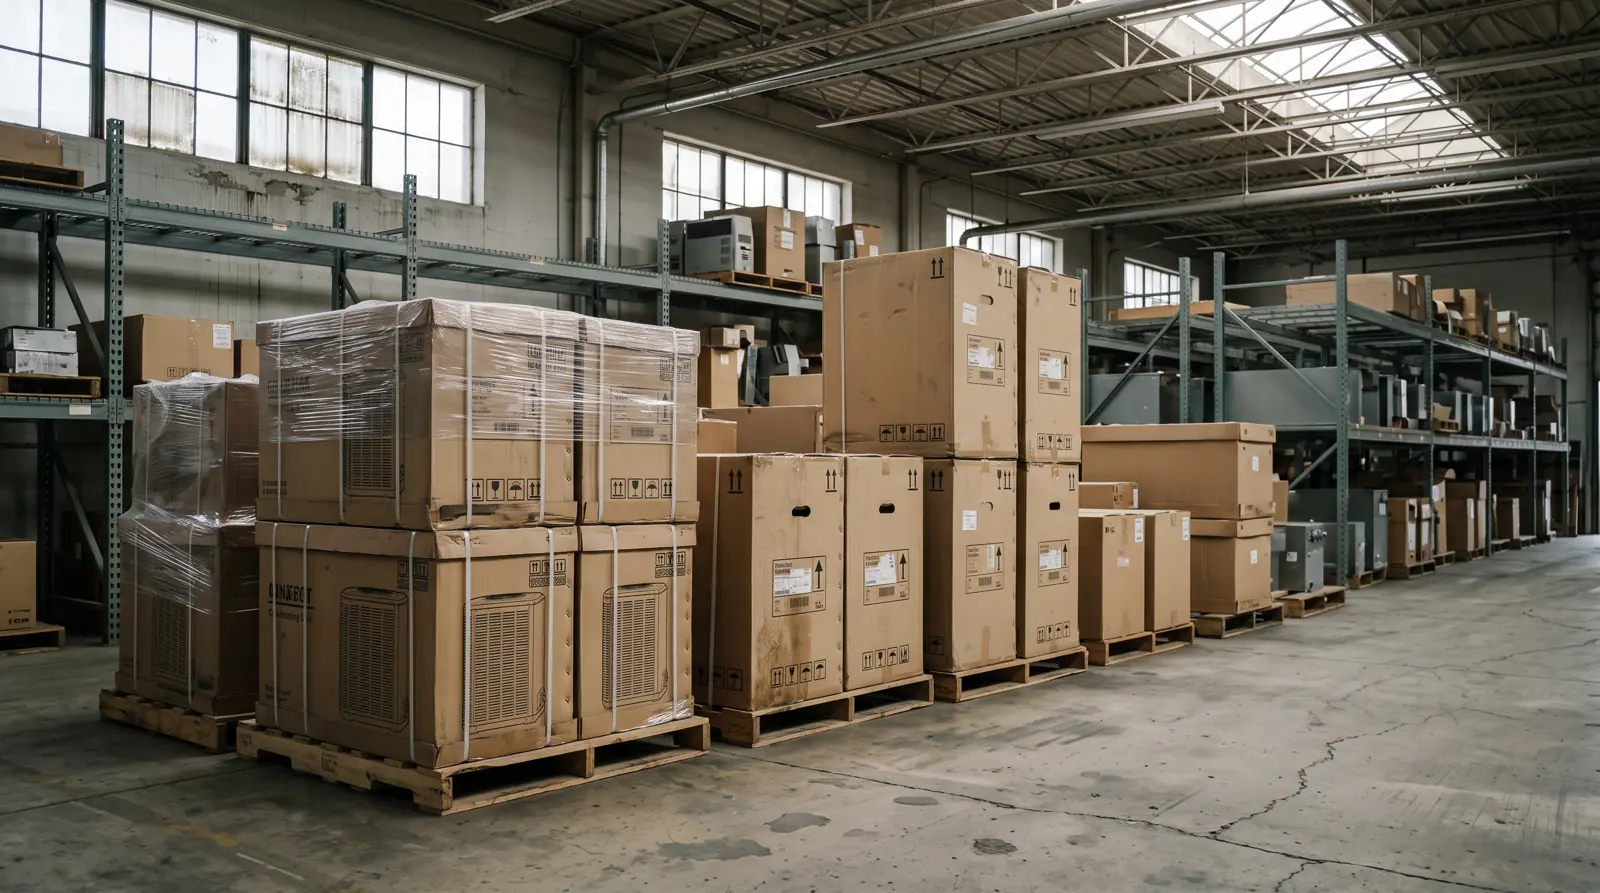
HVAC Price Increase Tracker: How Much Air Conditioner, Heat Pump and Furnace Prices Rose Since 2020
- Primary data
- BLS Producer Price Index, NAICS 333415 product indexes (PCU333415333415E, H, C); CPI-U; CES average hourly earnings for NAICS 23822
- Data period
- January 2015 to September 2026 (PPI, CPI); to August 2026 (earnings)
- Latest release used
- 2026-10-15
- Next release
- October 2026 PPI on 2026-11-13; October 2026 CPI on 2026-11-10
- Geography
- United States
- Sources
- 19 (18 Tier 1)
From January 2020 to September 2026, U.S. producer prices for unitary air conditioners rose 57.6%, according to the BLS Producer Price Index (series PCU333415333415E). That HVAC price increase compares with 30.6% for consumer prices (CPI-U). Warm-air furnace prices also rose 57.6%, while heat pump prices rose 20.8%, less than inflation.
This month in brief
- Producer prices for unitary air conditioners rose 57.6% from January 2020 to September 2026 (BLS series PCU333415333415E, September preliminary).
- Producer prices for warm-air furnaces also rose 57.6% over the same months (PCU333415333415C); the whole NAICS 333415 equipment industry rose 60.4%.
- Heat pump producer prices rose 20.8% (PCU333415333415H), less than the 30.6% rise in CPI-U, and are 8.2% below their May 2025 peak.
- Average hourly earnings at plumbing and HVAC contractors rose 37.4% from January 2020 to August 2026, so air conditioners and furnaces outran contractor pay and heat pumps did not.
- The fastest climb came in 2021 and 2022: 46.1% of the air conditioner index rise since January 2020 happened between December 2020 and December 2022.
- Neither federal deadline shows up as a one-month jump: the AC index rose 1.1% in January 2023 (SEER2) and fell 0.6% in January 2025 (refrigerant limit).
- Metal inputs rose faster than finished equipment: cold rolled steel sheet up 125.3% and copper pipe and tube up 111.2% since January 2020.
- These are producer prices received by domestic manufacturers. They exclude tariffs, distributor markups and installation labor, so they are not the price on a homeowner's quote.
The HVAC price increase since 2020: air conditioners and furnaces up 57.6%, heat pumps up 20.8%
Three BLS product indexes inside NAICS 333415 track what domestic manufacturers receive for central air conditioners, heat pumps and warm-air furnaces. Two of them rose almost twice as fast as consumer prices from January 2020 to September 2026. The heat pump index rose less than inflation.
Producer Price Index (PPI): A BLS index of the prices domestic producers receive for their output at the first sale, excluding excise taxes and tariffs. It is not the distributor price a contractor pays and not the installed price a homeowner pays. Changes are reported as percent changes because index levels depend on each series' base period (BLS Handbook of Methods).
The unitary air conditioner index (PCU333415333415E, December 1982 = 100) was 189.2 in January 2020 and 298.154 in September 2026, a 57.6% increase (BLS PPI flat files). BLS labels it "unitary air-conditioners, except air source heat pumps", so room units and heat pumps are tracked elsewhere.
The warm-air furnace index (PCU333415333415C, December 1989 = 100) went from 164.7 to 259.617, also 57.6%. It covers warm-air furnaces including duct furnaces, humidifiers and electric comfort heating. The broader commodity index for furnaces and heaters including parts (WPU106201) rose 52.6%.
The heat pump index (PCU333415333415H, December 2009 = 100) went from 117.1 to 141.447, a 20.8% increase. The separate commodity code for heat pumps (WPU11480734) gives 21.0%, so the result does not depend on which BLS code is used.
Percent change, January 2020 to latest month
Source: BLS PPI, CPI and CES flat files; latest month September 2026 except earnings (August 2026) and copper pipe (April 2026).
| Rank | Series | Group | BLS series ID | Base period | Jan 2020 value | Latest month | Latest value | Change since Jan 2020 (%) | Gap vs CPI-U (percentage points) |
|---|---|---|---|---|---|---|---|---|---|
| 1 | Cold rolled steel sheet and strip | Input | WPU101707 | Jun 1982=100 | 218.6 | Sep 2026 | 492.454 (p) | 125.3 | +94.7 |
| 2 | Copper and copper alloy pipe and tube | Input | WPU10250239 | Jun 2004=100 | 192.3 | Apr 2026 | 406.17 | 111.2 | +80.6 |
| 3 | Copper wire and cable | Input | WPU10260314 | Dec 1986=100 | 302.1 | Sep 2026 | 607.705 (p) | 101.2 | +70.6 |
| 4 | Aluminum mill shapes | Input | WPU102501 | 1982=100 | 192.3 | Sep 2026 | 370.48 (p) | 92.7 | +62.1 |
| 5 | NAICS 333415 industry (all HVAC and refrigeration equipment) | Equipment | PCU333415333415 | Dec 1982=100 | 204.2 | Sep 2026 | 327.608 (p) | 60.4 | +29.8 |
| 6 | Unitary air conditioners | Equipment | PCU333415333415E | Dec 1982=100 | 189.2 | Sep 2026 | 298.154 (p) | 57.6 | +27.0 |
| 7 | Warm-air furnaces | Equipment | PCU333415333415C | Dec 1989=100 | 164.7 | Sep 2026 | 259.617 (p) | 57.6 | +27.0 |
| 8 | Parts and accessories for AC and heat transfer equipment | Equipment | PCU333415333415D | Dec 1989=100 | 186.2 | Sep 2026 | 292.258 (p) | 57.0 | +26.4 |
| 9 | Furnaces and heaters incl. parts (commodity) | Equipment | WPU106201 | 1982=100 | 221.2 | Sep 2026 | 337.509 (p) | 52.6 | +22.0 |
| 10 | Average hourly earnings, plumbing and HVAC contractors | Comparison | CEU2023822003 | dollars | 31.06 | Aug 2026 | 42.69 (p) | 37.4 | +6.8 |
| 11 | PPI plumbing and HVAC contractors, nonresidential work | Comparison | PCU23822X23822X | Dec 2007=100 | 138.8 | Sep 2026 | 187.203 (p) | 34.9 | +4.3 |
| 12 | PPI final demand | Comparison | WPUFD4 | Nov 2009=100 | 119 | Sep 2026 | 159.613 (p) | 34.1 | +3.5 |
| 13 | CPI-U all items (consumer inflation) | Comparison | CUUR0000SA0 | 1982-84=100 | 257.971 | Sep 2026 | 336.94 | 30.6 | +0.0 |
| 14 | Heat pumps | Equipment | PCU333415333415H | Dec 2009=100 | 117.1 | Sep 2026 | 141.447 (p) | 20.8 | -9.8 |
Percent change of index levels, not seasonally adjusted; (p) = preliminary. Latest month is September 2026 except contractor earnings (August 2026) and copper pipe and tube (April 2026, last published). Gap vs CPI-U compares with CPI-U January 2020 to September 2026.
Source: [1][2][3][4] U.S. Bureau of Labor Statistics; U.S. Bureau of Labor Statistics; U.S. Bureau of Labor Statistics; U.S. Bureau of Labor Statistics
For an HVAC company owner: every $1.00 of air conditioner or furnace output at January 2020 producer prices cost $1.576 in September 2026, and every $1.00 of heat pump output cost $1.208, before distributor margin, freight or tariffs reach the contractor.
Air conditioners and furnaces outran both inflation and contractor paychecks
The signature comparison in this tracker sets each equipment index against CPI-U and against average hourly earnings at plumbing and HVAC contractors (NAICS 23822). AC and furnace prices rose faster than both. Heat pumps rose slower than both.
Index, January 2020 = 100, monthly, not seasonally adjusted
Source: BLS PPI (PCU333415333415E, C, H), CPI-U (CUUR0000SA0), CES (CEU2023822003); HVAC Business Brokers Research Desk calculation. October 2025 CPI not collected.
From January 2020 to September 2026, CPI-U rose 30.6% (BLS CPI flat files). After removing that inflation, unitary air conditioner and warm-air furnace producer prices each rose 20.7% in real terms. Heat pump producer prices fell 7.5% in real terms.
Average hourly earnings of all employees at plumbing, heating and air-conditioning contractors rose from $31.06 in January 2020 to $42.69 in August 2026, up 37.4% (BLS CES flat files). Measured over the same months, the unitary air conditioner index rose 57.6% and the furnace index 52.2%.
| Equipment index | BLS series ID | Equipment change Jan 2020 to Aug 2026 (%) | Contractor hourly pay change Jan 2020 to Aug 2026 (%) | Equipment price measured in hours of pay (% change) |
|---|---|---|---|---|
| Unitary air conditioners | PCU333415333415E | 57.6 | 37.4 | +14.7 |
| Warm-air furnaces | PCU333415333415C | 52.2 | 37.4 | +10.7 |
| Heat pumps | PCU333415333415H | 20.8 | 37.4 | -12.1 |
| NAICS 333415 industry (all HVAC and refrigeration equipment) | PCU333415333415 | 60.2 | 37.4 | +16.5 |
Pay = average hourly earnings of all employees, NAICS 23822 (plumbing, heating and AC contractors), not seasonally adjusted. Last column = (1 + equipment change) / (1 + pay change) – 1.
Source: [1][4] U.S. Bureau of Labor Statistics; U.S. Bureau of Labor Statistics
Index, January 2020 = 100; equipment PPI divided by NAICS 23822 average hourly earnings
Source: BLS PPI and CES; HVAC Business Brokers Research Desk calculation.
The BLS index for what plumbing and HVAC contractors charge on nonresidential building work (PCU23822X23822X) rose 34.9% from January 2020 to September 2026. BLS publishes no matching index for residential replacement work.
Most of the climb came in 2021 and 2022, not at the SEER2 or refrigerant deadlines
Two federal deadlines changed which central air conditioners and heat pumps could be made: SEER2 minimums on January 1, 2023 and the refrigerant limit on January 1, 2025. Neither month shows an unusual jump in the BLS indexes. The steepest rise came earlier.
| Date | Action | Official citation | Type |
|---|---|---|---|
| 2023-01-01 | SEER2 and HSPF2 minimums for central AC and heat pumps manufactured on or after this date | 10 CFR 430.32(c)(5) | Efficiency standard (DOE) |
| 2025-01-01 | No manufacture or import of self-contained residential AC and heat pump products using refrigerant with GWP 700 or greater | 40 CFR 84.54(a)(1) | Refrigerant transition (EPA) |
| 2025-06-04 | Section 232 duty on steel and aluminum articles and derivatives raised to 50 percent | Proclamation 10947, 90 FR 24199 | Tariff (imports) |
| 2025-08-01 | 50 percent Section 232 duty on semi-finished copper products and intensive copper derivatives | Proclamation 10962, 90 FR 37727 | Tariff (imports) |
| 2026-06-08 | Certain residential HVAC systems and components placed in the temporarily reduced 15 percent derivative category | Proclamation 11032, 91 FR 34085 | Tariff (imports) |
| 2028-12-18 | Next AFUE step for non-weatherized gas furnaces (future) | 10 CFR 430.32(e)(1)(ii) | Efficiency standard (DOE) |
From the eCFR and Federal Register, read 2026-11-02. Tariff actions apply to imports; the PPI excludes tariffs.
Source: [14][15][16][17][18] Office of the Federal Register / U.S. Department of Energy; Office of the Federal Register / U.S. EPA; Office of the Federal Register; Office of the Federal Register; Office of the Federal Register
Under 10 CFR 430.32(c)(5), central air conditioners and heat pumps manufactured on or after January 1, 2023 must meet SEER2 and HSPF2 minimums (eCFR). Under 40 CFR 84.54(a)(1), self-contained residential and light commercial AC and heat pump products using refrigerant with a GWP of 700 or greater cannot be made or imported from January 1, 2025 (eCFR). Details of the refrigerant rules are in the R410A phase out tracker.
Percent change from December to January, by year
Source: BLS PPI PCU333415333415E, H, C, not seasonally adjusted; regulatory dates from 10 CFR 430.32 and 40 CFR 84.54.
| Equipment index | BLS series ID | Dec 2022 to Jan 2023 (%) | Dec 2024 to Jan 2025 (%) | Median Dec to Jan, other years 2016 to 2026 (%) | Dec 2021 to Jan 2022 (%) | Calendar 2023 (%) | Calendar 2025 (%) |
|---|---|---|---|---|---|---|---|
| Unitary air conditioners | PCU333415333415E | 1.1 | -0.6 | 0.1 | 3.5 | 6.5 | 3.1 |
| Heat pumps | PCU333415333415H | -1.0 | 0.5 | 1.0 | 2.9 | -0.7 | 1.5 |
| Warm-air furnaces | PCU333415333415C | -0.3 | 1.0 | 0.7 | 4.6 | 3.2 | 6.9 |
Median uses 2016 to 2022, 2024 and 2026 (nine Januaries). Not seasonally adjusted.
Source: [1][14][15] U.S. Bureau of Labor Statistics; Office of the Federal Register / U.S. Department of Energy; Office of the Federal Register / U.S. EPA
The unitary air conditioner index rose 1.1% from December 2022 to January 2023 and fell 0.6% from December 2024 to January 2025. The median December to January change in the other nine years from 2016 to 2026 was 0.1%. The largest January move in the period was December 2021 to January 2022, up 3.5%, a year before the SEER2 date.
Between December 2020 and December 2022 the index gained 46.1% of all the points it added from January 2020 to September 2026. For the NAICS 333415 industry index the share was 59.8%.
Steel sheet and copper tube doubled while finished equipment rose by about half
Contractors buy line sets, wire and duct metal as well as equipment. BLS producer prices for those metals rose much faster than the finished-equipment indexes from January 2020, with the biggest swings in 2021 and in 2025 to 2026.
Cold rolled steel sheet and strip (WPU101707) rose 125.3% from January 2020 to September 2026. Copper and copper alloy pipe and tube (WPU10250239) rose 111.2% to April 2026, the latest month BLS published. Copper wire and cable rose 101.2% and aluminum mill shapes 92.7% (BLS PPI flat files).
Two Section 232 actions fall inside this window. The duty on steel and aluminum articles and derivatives rose to 50 percent on June 4, 2025 (90 FR 24199), and a 50 percent duty on semi-finished copper products took effect August 1, 2025 (90 FR 37727). BLS excludes tariffs from the PPI, but its handbook notes that domestic producers may raise their own prices when imports face tariffs, and those increases are counted (BLS).
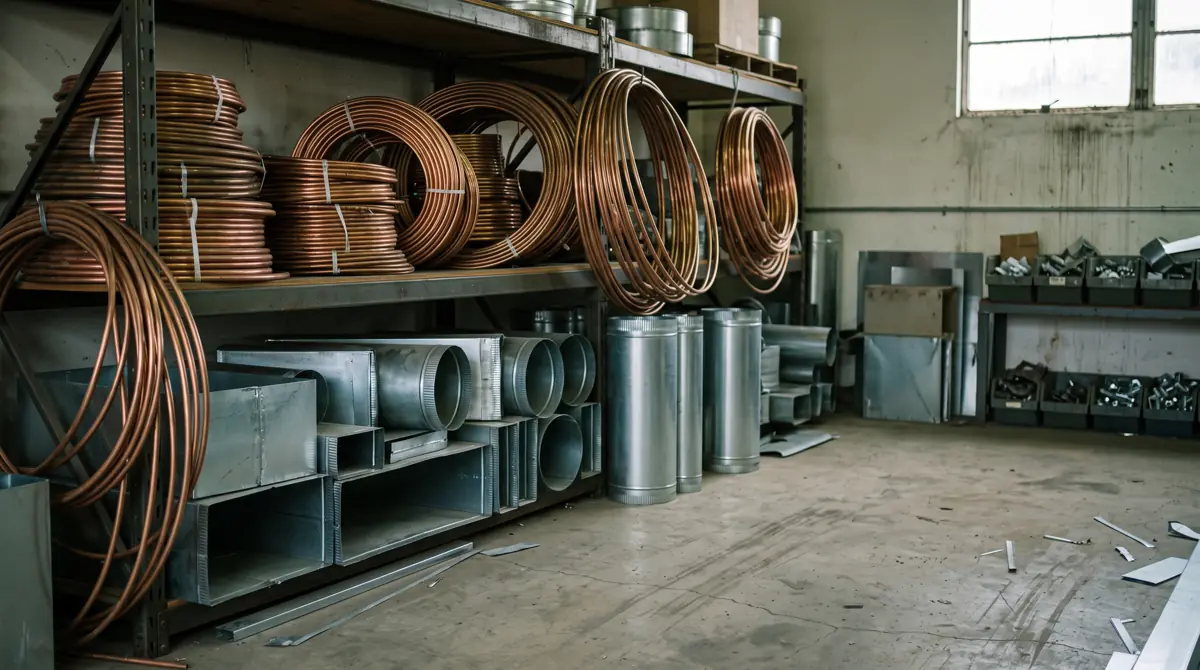
For an owner, metal-heavy materials are where quotes go stale fastest: these input indexes moved roughly twice as far as the equipment indexes since January 2020. This tracker does not attribute any part of the change to tariffs; the dates are listed for context only.
In the past 12 months, AC and furnace prices rose again while heat pumps fell
After two quieter years, the AC and furnace indexes picked up again in 2025 and 2026. The heat pump index moved the other way.
| Year | Unitary AC (%) | Heat pumps (%) | Warm-air furnaces (%) | NAICS 333415 (%) | CPI-U (%) |
|---|---|---|---|---|---|
| 2016 | 1.9 | -2.3 | -1.4 | 1.3 | 2.1 |
| 2017 | 2.1 | -0.1 | -0.3 | 1.7 | 2.1 |
| 2018 | 6.8 | 7.1 | 5.8 | 6.1 | 1.9 |
| 2019 | 7.5 | 0.3 | 7.7 | 3.5 | 2.3 |
| 2020 | 3.3 | 4.1 | 3.7 | 2.3 | 1.4 |
| 2021 | 7.7 | 8.7 | 16.2 | 15.5 | 7.0 |
| 2022 | 16.4 | 7.9 | 12.0 | 17.2 | 6.5 |
| 2023 | 6.5 | -0.7 | 3.2 | 3.7 | 3.4 |
| 2024 | 1.1 | 2.8 | 0.4 | 1.3 | 2.9 |
| 2025 | 3.1 | 1.5 | 6.9 | 5.0 | 2.7 |
| 2026 (Sep 2025 to Sep 2026) | 8.6 | -4.1 | 7.8 | 5.7 | 3.7 |
Last row compares September 2025 with September 2026 (PPI preliminary).
Source: [1][3] U.S. Bureau of Labor Statistics; U.S. Bureau of Labor Statistics
From September 2025 to September 2026 the unitary air conditioner index rose 8.6%, the warm-air furnace index 7.8% and the NAICS 333415 industry index 5.7%, compared with 3.7% for CPI-U. The heat pump index fell 4.1%, including a 4.9% drop from January to February 2026.
The heat pump index peaked at 154.098 in May 2025 and was 8.2% lower in September 2026. It printed the same value, 141.447, every month from May to September 2026; BLS revises preliminary months for 4 months, so that flat stretch may change. Shipment trends for heat pumps are in heat pump sales.
| Year | Unitary AC PPI (Dec 1982=100) | Heat pump PPI (Dec 2009=100) | Warm-air furnace PPI (Dec 1989=100) | NAICS 333415 PPI (Dec 1982=100) | CPI-U (1982-84=100) | Avg hourly earnings, plumbing and HVAC contractors ($) |
|---|---|---|---|---|---|---|
| 2015 | 159.7 | 110.4 | 144.3 | 179.8 | 237.0 | 27.54 |
| 2016 | 161.9 | 109.8 | 144.8 | 181.7 | 240.0 | 28.02 |
| 2017 | 166.2 | 108.0 | 143.2 | 185.2 | 245.1 | 28.55 |
| 2018 | 175.3 | 113.2 | 149.0 | 194.0 | 251.1 | 29.51 |
| 2019 | 189.8 | 116.9 | 161.2 | 203.0 | 255.7 | 30.39 |
| 2020 | 194.4 | 119.6 | 168.8 | 207.1 | 258.8 | 31.84 |
| 2021 | 206.8 | 126.1 | 182.6 | 224.1 | 271.0 | 33.54 |
| 2022 | 242.2 | 140.4 | 215.5 | 272.9 | 292.7 | 35.44 |
| 2023 | 261.1 | 141.4 | 223.8 | 290.9 | 304.7 | 37.13 |
| 2024 | 271.0 | 145.1 | 229.7 | 298.0 | 313.7 | 38.49 |
| 2025 | 276.0 | 148.2 | 237.2 | 307.6 | 321.9 | 40.23 |
| 2026 (Jan to Sep) | 292.0 | 141.7 | 252.1 | 321.9 | 332.2 | 41.88 |
2026 averages January to September. Index bases differ by series; compare percent changes, not levels across columns.
Source: [1][3][4] U.S. Bureau of Labor Statistics; U.S. Bureau of Labor Statistics; U.S. Bureau of Labor Statistics
What a producer index can and cannot say about a homeowner's quote
The PPI is the best official, monthly, product-level price series for HVAC equipment. It still leaves out most of what sits between a factory and a finished install.
- Covered: prices received by domestic producers, quality adjusted, for about 50,000 items a month across the economy (BLS).
- Not covered: tariffs, distributor and supply-house margins, freight to the contractor, labor, permits, ductwork changes, financing or contractor overhead.
- Imports: tariffs paid on imported equipment are excluded; domestic producers' responses to import tariffs are included (BLS).
- Revisions: PPI values are preliminary for 4 months after first release, so June to September 2026 can still change (BLS).
- Seasonality: every series used here is not seasonally adjusted, which is why calendar comparisons use the same month in each year.
- List prices: manufacturer price notices compiled by trade press are announcements, not transaction prices. In the October 2026 ACHR News list most announced changes fell between 3% and 6% (ACHR News, Tier 3 context only).
| Series | BLS series ID | Annual rate Jan 2015 to Jan 2020 (%) | Annual rate Jan 2020 to latest (%) | Share of index rise since Jan 2020 that came Dec 2020 to Dec 2022 (%) |
|---|---|---|---|---|
| Unitary air conditioners | PCU333415333415E | 3.2 | 7.1 | 46.1 |
| Heat pumps | PCU333415333415H | 1.4 | 2.9 | 85.8 |
| Warm-air furnaces | PCU333415333415C | 3.0 | 7.1 | 53.7 |
| NAICS 333415 industry (all HVAC and refrigeration equipment) | PCU333415333415 | 2.7 | 7.3 | 59.8 |
| CPI-U all items (consumer inflation) | CUUR0000SA0 | 2.0 | 4.1 | 46.0 |
Compound annual rates. Share = (Dec 2022 minus Dec 2020 index points) divided by (latest minus Jan 2020 index points).
Source: [1][3] U.S. Bureau of Labor Statistics; U.S. Bureau of Labor Statistics
The pace table shows the step change in trend: before 2020 the air conditioner index rose about 3.2% a year, and since January 2020 about 7.1% a year. CPI-U moved from 2.0% to 4.1% a year over the same spans. For owners thinking about a sale, see the main guide at sell my HVAC business.
Momentum and share analysis
Change since January 2020: Unitary air conditioners
Formula(PCU333415333415E Sep 2026 / PCU333415333415E Jan 2020 - 1) x 100
Inputs: fact rows 1, 2, 3, 4, 5, 6, 7 (fact sheet rows)
Result: 57.6 percent
Signature input. Unitary AC producer prices rose 57.6% over 80 months.
Limitations: Not seasonally adjusted; latest months preliminary
SIGNATURE: Gap vs CPI-U: Unitary air conditioners
Formulachange(PCU333415333415E) - change(CPI-U), Jan 2020 to Sep 2026
Inputs: fact rows 1, 2, 3, 4, 5, 6, 7, 71, 72, 73, 74, 75, 76, 77 (fact sheet rows)
Result: 27.0 percentage points
Signature figure. AC producer prices rose 27.0 percentage points more than consumer prices.
Limitations: Producer vs consumer index; different baskets
SIGNATURE: Gap vs CPI-U: Heat pumps
Formulachange(PCU333415333415H) - change(CPI-U), Jan 2020 to Sep 2026
Inputs: fact rows 8, 9, 10, 11, 12, 13, 14, 71, 72, 73, 74, 75, 76, 77 (fact sheet rows)
Result: -9.8 percentage points
Signature figure. Heat pump producer prices rose 9.8 points less than consumer prices.
Limitations: Producer vs consumer index; different baskets
SIGNATURE: Equipment price relative to contractor hourly pay: Unitary air conditioners
Formula((1 + change PCU333415333415E Jan 2020 to Aug 2026) / (1 + change AHE same months) - 1) x 100
Inputs: fact rows 1, 2, 3, 4, 5, 6, 7, 78, 79, 80, 81, 82, 83 (fact sheet rows)
Result: 14.7 percent
Signature figure. A unit of AC equipment at producer prices takes 14.7% more contractor pay-hours than in January 2020.
Limitations: Producer price, not the distributor or installed price; AHE covers all employees at plumbing and HVAC contractors
Equipment price relative to contractor hourly pay: Heat pumps
Formula((1 + change PCU333415333415H Jan 2020 to Aug 2026) / (1 + change AHE same months) - 1) x 100
Inputs: fact rows 8, 9, 10, 11, 12, 13, 14, 78, 79, 80, 81, 82, 83 (fact sheet rows)
Result: -12.1 percent
Heat pumps take 12.1% fewer pay-hours than in January 2020.
Limitations: Producer price, not the distributor or installed price; AHE covers all employees at plumbing and HVAC contractors
Inflation-adjusted change: Unitary air conditioners
Formula((1 + change PCU333415333415E) / (1 + change CPI-U) - 1) x 100
Inputs: fact rows 1, 2, 3, 4, 5, 6, 7, 71, 72, 73, 74, 75, 76, 77 (fact sheet rows)
Result: 20.7 percent
Real (CPI-adjusted) increase in AC producer prices.
Limitations: Deflating a producer index by a consumer index is an approximation
Share of Jan 2020 to Sep 2026 rise that came in 2021 and 2022: Unitary air conditioners
Formula(index Dec 2022 - index Dec 2020) / (index latest - index Jan 2020) x 100
Inputs: fact rows 1, 2, 3, 4, 5, 6, 7 (fact sheet rows)
Result: 46.1 percent of index-point rise
Nearly half of the AC rise came in the two years before the SEER2 date.
Limitations: Index-point shares depend on path; descriptive only
December 2022 to January 2023 change: Unitary air conditioners
Formula(Jan 2023 / Dec 2022 - 1) x 100
Inputs: fact rows 1, 2, 3, 4, 5, 6, 7 (fact sheet rows)
Result: 1.1 percent
No unusual one-month jump at the SEER2 date.
Limitations: NSA; one-month change
December 2024 to January 2025 change: Unitary air conditioners
Formula(Jan 2025 / Dec 2024 - 1) x 100
Inputs: fact rows 1, 2, 3, 4, 5, 6, 7 (fact sheet rows)
Result: -0.6 percent
No jump at the refrigerant date either.
Limitations: NSA; one-month change
Median December to January change, other years 2016 to 2026: Unitary air conditioners
Formulamedian of (Jan/Dec - 1) x 100 for 2016-2026 excluding 2023 and 2025
Inputs: fact rows 1, 2, 3, 4, 5, 6, 7 (fact sheet rows)
Result: 0.1 percent
Typical January move, the benchmark for the two regulatory months.
Limitations: 9 observations
Annualized change Jan 2020 to Sep 2026: Unitary air conditioners
Formula((latest / Jan 2020)^(12/80) - 1) x 100
Inputs: fact rows 1, 2, 3, 4, 5, 6, 7 (fact sheet rows)
Result: 7.1 percent per year
Pace since 2020 more than double the 2015 to 2020 pace of 3.2% a year.
Limitations: Compound rate; latest months preliminary
Findings to track
- The BLS producer price index for unitary air conditioners (PCU333415333415E) rose from 189.2 in January 2020 to 298.154 in September 2026 (preliminary), a 57.6% increase.[1]
- The warm-air furnace index (PCU333415333415C) rose from 164.7 in January 2020 to 259.617 in September 2026 (preliminary), also a 57.6% increase.[1]
- The heat pump index (PCU333415333415H) rose from 117.1 in January 2020 to 141.447 in September 2026 (preliminary), a 20.8% increase.[1]
- The NAICS 333415 industry index for air conditioning, refrigeration and forced-air heating equipment rose 60.4% from January 2020 to September 2026.[1]
- CPI-U for all items rose 30.6% from January 2020 to September 2026, so unitary air conditioner producer prices rose 27.0 percentage points more than consumer prices.[1][3]
- After adjusting for CPI-U, unitary air conditioner and warm-air furnace producer prices each rose 20.7% in real terms from January 2020 to September 2026; heat pumps fell 7.5%.[1][3]
- Average hourly earnings of all employees at plumbing, heating and air-conditioning contractors rose from $31.06 in January 2020 to $42.69 in August 2026 (preliminary), a 37.4% increase.[4]
- Measured in hours of contractor pay, unitary air conditioners at producer prices cost 14.7% more in August 2026 than in January 2020, furnaces 10.7% more and heat pumps 12.1% less.[1][4]
- The BLS price index for what plumbing and HVAC contractors charge for nonresidential building work rose 34.9% from January 2020 to September 2026, less than the equipment indexes.[1]
- The unitary air conditioner index rose at 3.2% a year from January 2015 to January 2020 and at 7.1% a year from January 2020 to September 2026.[1]
- In calendar 2022 the unitary air conditioner index rose 16.4%, its largest Dec to Dec increase since at least 2016.[1]
- The air conditioner index changed 1.1% in January 2023 and minus 0.6% in January 2025, against a median December to January change of 0.1% in the other years from 2016 to 2026.[1][14][15]
- Over the 12 months to September 2026, unitary air conditioner producer prices rose 8.6% and warm-air furnace prices 7.8%, while heat pump prices fell 4.1%.[1]
- Producer prices for cold rolled steel sheet rose 125.3%, copper wire and cable 101.2% and aluminum mill shapes 92.7% from January 2020 to September 2026.[2]
Questions people ask
How much have HVAC prices gone up?
At the producer level, a lot more than inflation for most equipment. From January 2020 to September 2026 the BLS index for unitary air conditioners rose 57.6%, warm-air furnaces 57.6% and heat pumps 20.8%, against 30.6% for CPI-U. Installed prices also include labor, distributor margin and tariffs, which these indexes do not measure.
Why are air conditioners so expensive in 2026?
The official data show three things. Producer prices for unitary air conditioners are at a record in this series: 298.154 in August and September 2026 (preliminary), 8.6% above September 2025. Metal inputs rose faster still, with cold rolled steel sheet up 125.3% and copper wire up 101.2% since January 2020. And the 2023 SEER2 and 2025 refrigerant rules changed which units can be made. The data cannot split the increase among these causes.
How much did furnace prices rise since 2020?
The BLS producer price index for warm-air furnaces (PCU333415333415C) rose 57.6% from January 2020 to September 2026 (preliminary). The broader commodity index for furnaces and heaters including parts rose 52.6%. The next federal furnace efficiency step applies to non-weatherized gas furnaces made on or after December 18, 2028, so no federal furnace standard changed during this period.
Download the data
Every table in this report is available as a CSV under CC BY 4.0. The fact sheet lists each value with its source URL and access date.
- derived_metrics.csv (CSV)
- fact_sheet.csv (CSV)
- t1_cumulative_since_2020.csv (CSV)
- t2_annual_averages.csv (CSV)
- t3_calendar_year_changes.csv (CSV)
- t4_regulatory_months.csv (CSV)
- t5_equipment_vs_wages.csv (CSV)
- t6_pace_and_timing.csv (CSV)
- t8_policy_dates.csv (CSV)
For journalists and researchers
If you cite only a few, cite these
- Unitary AC producer prices: up 57.6%, January 2020 to September 2026 (BLS PPI); CPI-U up 30.6%.[1][3]
- Heat pump producer prices: up 20.8% over the same months, below inflation.[1]
- AC equipment in hours of contractor pay: up 14.7%, January 2020 to August 2026.[1][4]
Most quotable statistics
- U.S. producer prices for unitary air conditioners rose 57.6% from January 2020 to September 2026, compared with 30.6% for consumer prices (BLS PPI and CPI-U).[1][3]
- Heat pump producer prices rose 20.8% from January 2020 to September 2026, 9.8 percentage points less than consumer prices (BLS PPI PCU333415333415H).[1][3]
- Measured in hours of pay at plumbing and HVAC contractors, an air conditioner at producer prices cost 14.7% more in August 2026 than in January 2020 (HVAC Business Brokers Research Desk, from BLS PPI and CES).[1][4]
- 46.1% of the rise in the BLS air conditioner price index since January 2020 came between December 2020 and December 2022, before the January 2023 SEER2 date.[1][14]
- The BLS air conditioner price index rose 1.1% in January 2023 and fell 0.6% in January 2025, the months federal efficiency and refrigerant rules took effect.[1][14][15]
- Producer prices for cold rolled steel sheet rose 125.3% and for copper wire and cable 101.2% from January 2020 to September 2026 (BLS PPI).[2]
Press summary
A tracker from the HVAC Business Brokers Research Desk finds that U.S. producer prices for central air conditioners rose 57.6% from January 2020 to September 2026, nearly double the 30.6% rise in consumer prices, according to Bureau of Labor Statistics Producer Price Index data. Warm-air furnace producer prices also rose 57.6%, while heat pump prices rose 20.8%, less than inflation, and have fallen 8.2% since May 2025. Measured against the hourly pay of employees at plumbing and HVAC contractors, which rose 37.4%, an air conditioner at producer prices now costs 14.7% more hours of pay than in January 2020. The steepest increases came in 2021 and 2022; the months when federal SEER2 efficiency minimums (January 2023) and refrigerant limits (January 2025) took effect show no unusual jump in the index. Producer prices exclude tariffs, distributor margins and installation, so they are not homeowner installed prices.
Suggested headlines
- Air Conditioner Producer Prices Up 57.6% Since 2020, Nearly Double Inflation
- Heat Pump Prices Rose Less Than Inflation Since 2020, BLS Data Show
- An AC Unit Now Costs 14.7% More Hours of HVAC Contractor Pay Than in 2020
- The SEER2 and Refrigerant Deadlines Barely Register in Federal Price Data
- Copper and Steel Inputs Doubled While HVAC Equipment Rose by Half
How to cite this report
HVAC Business Brokers. (2026). HVAC Price Increase Tracker: How Much Air Conditioner, Heat Pump and Furnace Prices Rose Since 2020. Retrieved from https://sell-my-hvac-business.com/research/hvac-price-increase/
Reuse license
Data and tables are licensed CC BY 4.0. Attribution: “Source: HVAC Business Brokers, HVAC Price Increase Tracker: How Much Air Conditioner, Heat Pump and Furnace Prices Rose Since 2020” with a link to this page.
Frequently asked questions
What is the latest HVAC price increase in the official data?
In the BLS release of October 15, 2026, the unitary air conditioner producer price index was 8.6% higher in September 2026 than in September 2025, and the warm-air furnace index was 7.8% higher. Both values are preliminary.
Did heat pump prices go up as much as air conditioner prices?
No. The heat pump producer price index rose 20.8% from January 2020 to September 2026, compared with 57.6% for unitary air conditioners, a gap of 36.8 percentage points.
Did heat pump prices fall in 2026?
Yes, at the producer level. The heat pump index fell 4.1% in the 12 months to September 2026 and was 8.2% below its May 2025 peak of 154.098.
Did the SEER2 rule in 2023 cause a price jump?
Not one the PPI shows in a single month. The air conditioner index rose 1.1% from December 2022 to January 2023, compared with a median January change of 0.1% in other years. The index did rise 6.5% over calendar 2023.
Did the 2025 refrigerant change raise prices?
The air conditioner index fell 0.6% from December 2024 to January 2025 and rose 3.1% over calendar 2025. BLS quality adjustment may record part of a model change as quality rather than price, so a small index move does not prove prices at the counter were flat.
Have contractor wages kept up with equipment prices?
Not for air conditioners or furnaces. Average hourly earnings at plumbing and HVAC contractors rose 37.4% from January 2020 to August 2026, while the AC index rose 57.6% and the furnace index 52.2% over the same months.
How fast are HVAC equipment prices rising compared with before 2020?
The unitary AC index rose 3.2% a year from January 2015 to January 2020 and 7.1% a year from January 2020 to September 2026.
How much have copper and steel prices risen for HVAC work?
From January 2020, BLS producer prices rose 111.2% for copper and copper alloy pipe and tube (to April 2026), 101.2% for copper wire and cable and 125.3% for cold rolled steel sheet (to September 2026).
Do these numbers include tariffs?
No. BLS excludes tariffs from the PPI because producers do not keep them as revenue. Price increases that domestic producers make in response to import tariffs are included.
When is the next update?
BLS is scheduled to publish October 2026 PPI data on November 13, 2026 and October 2026 CPI data on November 10, 2026. This tracker is refreshed after each PPI release.
Reproduce this analysis
Every figure comes from the files below. The scripts that pulled and computed them are kept with the report and can be re-run.
| Dataset | Publisher | Source | Query or filter | Rows used | Retrieved |
|---|---|---|---|---|---|
| PPI industry data (NAICS 333415 products, 23822X contractors) | U.S. Bureau of Labor Statistics | File or endpoint | series PCU333415333415, PCU333415333415E, H, C, D; plus pc.data.75.Construction for PCU23822X23822X; monthly periods M01 to M12, 2015 onward | 141 monthly rows per series, January 2015 to September 2026 | 2026-11-02 |
| PPI commodity data (metals, furnaces, final demand, cross-checks) | U.S. Bureau of Labor Statistics | File or endpoint | WPU101707, WPU10250239, WPU10260314, WPU102501 (11a); WPU106201 (11b); WPU114802, WPU11480734 (12b); WPUFD4 (22) | 122 to 141 monthly rows per series | 2026-11-02 |
| CPI-U all items, U.S. city average, NSA | U.S. Bureau of Labor Statistics | File or endpoint | series CUUR0000SA0, monthly, 2015 onward | 141 monthly rows; October 2025 blank | 2026-11-02 |
| CES average hourly earnings, NAICS 23822 | U.S. Bureau of Labor Statistics | File or endpoint | series CEU2023822003 (data type 03, all employees), monthly, 2015 onward | 140 monthly rows, January 2015 to August 2026 | 2026-11-02 |
| 10 CFR 430.32 and 40 CFR 84.54 | eCFR (Office of the Federal Register) | File or endpoint | Title 10 issue 2026-10-26 section 430.32; Title 40 issue 2026-10-28 section 84.54 | 2 sections; 3 dates coded | 2026-11-02 |
| Section 232 proclamations | Federal Register API | File or endpoint | presidential documents since 2025-01-01, terms 'steel aluminum section 232' and 'copper'; 3 proclamations kept | 30 hits, 3 used | 2026-11-02 |
Data quality and exclusions
- Monthly extract: 18 BLS series read from flat files; annual-average rows (period M13) dropped from every series before computing.
- CPI-U October 2025 is blank in the BLS file (BLS did not collect CPI data from October 1 to November 12, 2025); 1 month left blank and shown as a gap in chart c1. It does not affect any January 2020 to September 2026 comparison.
- Copper and copper alloy pipe and tube (WPU10250239) is missing 14 months since 2015, including most of 2025, and ends in April 2026; its change is reported to April 2026 and labelled.
- Sheet metal air-conditioning ducts (WPU10730120) dropped: no January 2020 value and 30 missing months.
- Commodity warm-air furnaces (WPU1062014611) dropped: discontinued after May 2024 and has a gap from 2009 to 2019.
- Preliminary values: 4 months (June to September 2026) are flagged P for every PPI series; earnings for August 2026 are flagged P.
- Repeated values: the heat pump index shows the same value in consecutive months 8 times since January 2025 (including May to September 2026); kept as published and flagged in the text.
- January 2020 PPI values are published to one decimal place, later values to three; percent changes use the published values without re-rounding.
Methodology
Source selection. Equipment prices come only from BLS Producer Price Index flat files at download.bls.gov (industry files posted October 15, 2026 with September 2026 data). The three headline series are product indexes inside NAICS 333415, chosen because all three run without a break from before 2015 to September 2026: PCU333415333415E (unitary air conditioners, except air-source heat pumps, base December 1982), PCU333415333415H (heat pumps, base December 2009) and PCU333415333415C (warm-air furnaces including duct furnaces, humidifiers and electric comfort heating, base December 1989). Commodity codes WPU114802 and WPU11480734 serve as cross-checks.
Comparisons. CPI-U all items, U.S. city average, not seasonally adjusted (CUUR0000SA0), and average hourly earnings of all employees at plumbing, heating and air-conditioning contractors (CEU2023822003, not seasonally adjusted, latest August 2026). Input series: cold rolled steel sheet and strip (WPU101707), copper and copper alloy pipe and tube (WPU10250239), copper wire and cable (WPU10260314), aluminum mill shapes (WPU102501). Contractor output price: PCU23822X23822X, nonresidential building work only.
Inclusion and exclusion. Series with a January 2020 value and data through 2026 were kept. Sheet metal air-conditioning ducts (WPU10730120) was dropped because it has no January 2020 value; the commodity warm-air furnace series (WPU1062014611) was dropped because BLS stopped it in May 2024. Manufacturer list-price announcements and contractor-blog estimates were not used as evidence (see excluded.md).
Derived metrics. Cumulative change = (latest / January 2020 – 1) x 100. Real change = ((1 + equipment change) / (1 + CPI-U change) – 1) x 100. Pay-hours ratio = ((1 + equipment change) / (1 + earnings change) – 1) x 100, both measured January 2020 to August 2026. Regulatory-month test compares the December to January change in 2023 and 2025 with the median of the nine other Januaries from 2016 to 2026. All formulas are in derived_metrics.csv and scripts/03_compute.py.
Conflicts. Commodity and industry codes for the same product differ slightly in level; percent changes agree within 0.2 points for heat pumps and match for unitary air conditioners, so the industry codes are reported. Where a newer release existed (the PPI flat files were refreshed October 15, 2026) it replaced earlier figures.
Limitations and update. PPI values for June to September 2026 are preliminary and are revised for 4 months. All series are not seasonally adjusted. Last updated November 2, 2026; next refresh after the November 13, 2026 PPI release.
This report presents published data with its limitations. It is not legal, financial or investment advice.
Sources, ranked by quality
Tier 1: primary and official sources (18)
- [1] U.S. Bureau of Labor Statistics. PPI industry data flat files (pc.series, pc.data.19.Machinery, pc.data.75.Construction), posted 2026-10-15. monthly, 2015 to September 2026. Accessed 2026-11-02.
- [2] U.S. Bureau of Labor Statistics. PPI commodity data flat files (wp.series, wp.data.11a, 11b, 12b, 22), posted 2026-10-15. monthly, 2015 to September 2026. Accessed 2026-11-02.
- [3] U.S. Bureau of Labor Statistics. CPI flat files (cu.series, cu.data.1.AllItems), posted 2026-10-19. monthly, 2015 to September 2026. Accessed 2026-11-02.
- [4] U.S. Bureau of Labor Statistics. Current Employment Statistics flat file ce.data.20b.Construction.AllEmployeeHoursAndEarnings, posted 2026-10-14. monthly, 2015 to August 2026. Accessed 2026-11-02.
- [5] U.S. Bureau of Labor Statistics. Producer Price Index News Release, September 2026 (USDL 26-1576, released 2026-10-15). September 2026. Accessed 2026-11-02.
- [6] U.S. Bureau of Labor Statistics. Consumer Price Index News Release, September 2026 (USDL-26-1574, released 2026-10-14). September 2026. Accessed 2026-11-02.
- [7] U.S. Bureau of Labor Statistics. Schedule of Releases for the Producer Price Index. 2026 to 2027. Accessed 2026-11-02.
- [8] U.S. Bureau of Labor Statistics. Schedule of Releases for the Consumer Price Index. 2026 to 2027. Accessed 2026-11-02.
- [9] U.S. Bureau of Labor Statistics. Schedule of Releases for the Employment Situation. 2026 to 2027. Accessed 2026-11-02.
- [10] U.S. Bureau of Labor Statistics. Handbook of Methods, Producer Price Indexes: Calculation. current. Accessed 2026-11-02.
- [11] U.S. Bureau of Labor Statistics. Handbook of Methods, Producer Price Indexes: Concepts. current. Accessed 2026-11-02.
- [12] U.S. Bureau of Labor Statistics. Handbook of Methods, Producer Price Indexes: Presentation. current. Accessed 2026-11-02.
- [13] U.S. Bureau of Labor Statistics. 2025 Federal Government Shutdown Impact on Consumer Expenditure Surveys and Consumer Price Index. October to November 2025. Accessed 2026-11-02.
- [14] Office of the Federal Register / U.S. Department of Energy. 10 CFR 430.32, Energy and water conservation standards (eCFR issue 2026-10-26). current text, read 2026-11-02. Accessed 2026-11-02.
- [15] Office of the Federal Register / U.S. EPA. 40 CFR 84.54, Restrictions on the use of hydrofluorocarbons (eCFR issue 2026-10-28). current text, read 2026-11-02. Accessed 2026-11-02.
- [16] Office of the Federal Register. Proclamation 10947, Adjusting Imports of Aluminum and Steel Into the United States, 90 FR 24199. published 2025-06-09. Accessed 2026-11-02.
- [17] Office of the Federal Register. Proclamation 10962, Adjusting Imports of Copper Into the United States, 90 FR 37727. published 2025-08-05. Accessed 2026-11-02.
- [18] Office of the Federal Register. Proclamation 11032, Further Adjusting the Tariff Regimes for Imports of Aluminum, Steel, and Copper, 91 FR 34085. published 2026-06-04. Accessed 2026-11-02.
Tier 3: journalism and expert commentary (1)
- [19] ACHR News. HVAC Price Increase List: October 2026. October 2026. Accessed 2026-11-02.