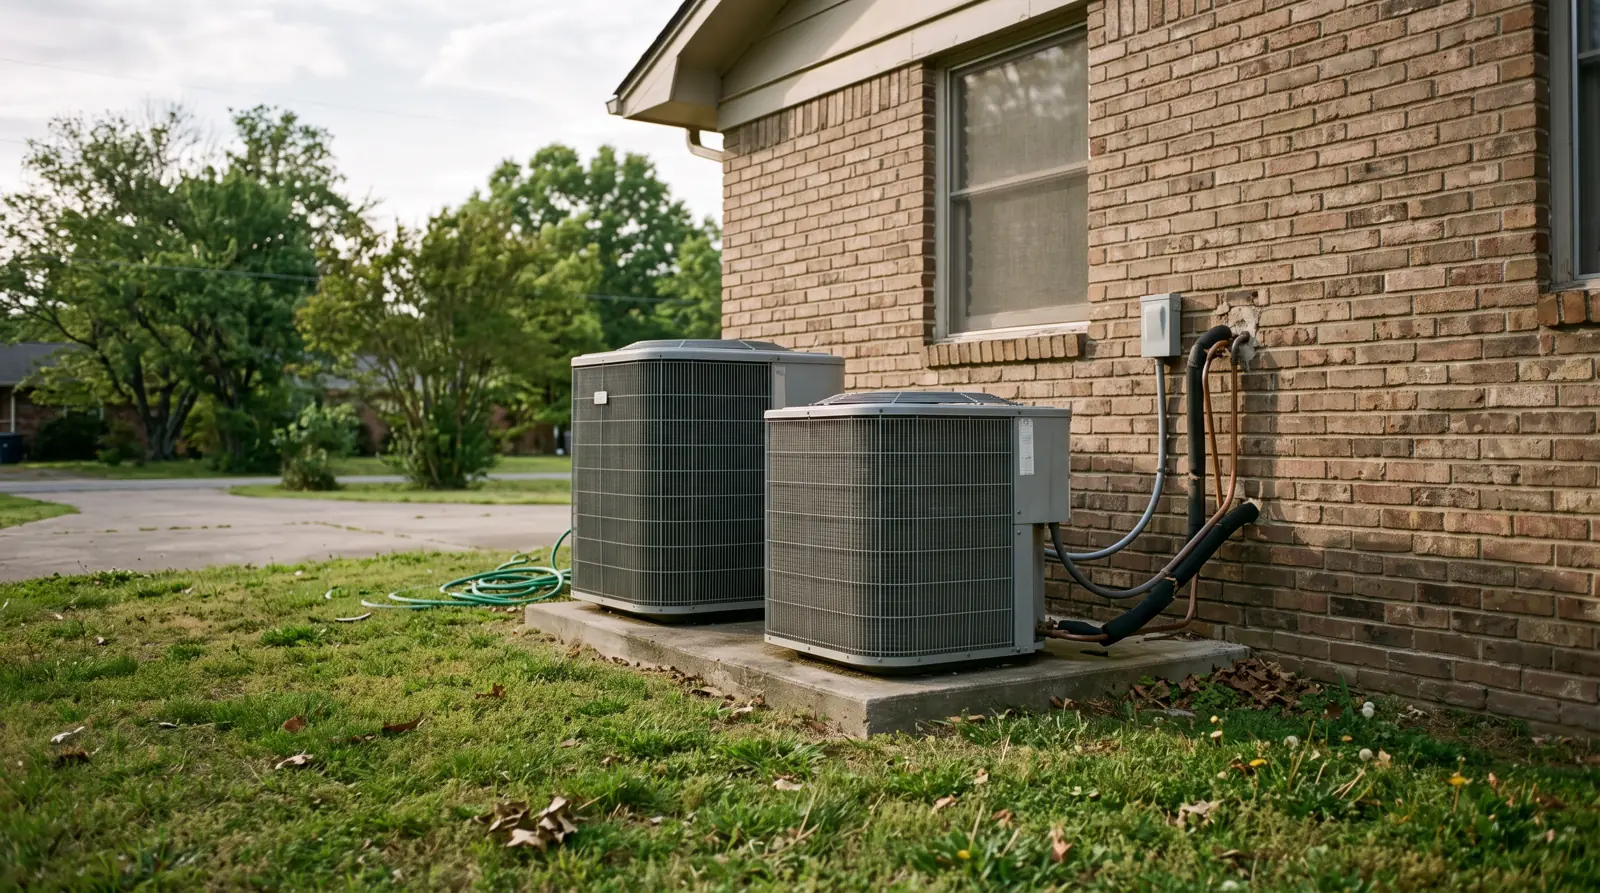
Percentage of Homes With Central Air: 67% Nationally, 90.4% in Florida, 7.5% in Vermont
- Primary data
- EIA Residential Energy Consumption Survey (RECS) 2020 microdata and state tables; Census American Housing Survey 1985 to 2023
- Data period
- RECS 2020; AHS 1985 to 2023; ACS 2025; LACE 2023; RECS 2024 (energy insecurity only)
- Latest release used
- 2026-10-29
- Next release
- RECS 2024 air conditioning tables, spring 2027 (EIA)
- Geography
- United States, 50 states and DC, census divisions
- Sources
- 25 (22 Tier 1)
The percentage of homes with central air in the United States was 67% in 2020, according to the U.S. Energy Information Administration's Residential Energy Consumption Survey: 83.16 million of 123.53 million occupied homes used central AC or a central heat pump. Another 26% used window, wall, portable or mini-split units, and 11.3% used no air conditioning.
The percentage of homes with central air runs from 90.4% in Florida to 7.5% in Vermont
Central air is the default across the South and most of the Midwest and the exception in the Northeast corridor, the Pacific Northwest, Hawaii and the northern Rockies. The split follows climate and building age more than income.
Central air (RECS definition): A home counts as using central air when its main or secondary cooling equipment is a central air conditioner or a central (ducted) heat pump. Ductless mini-splits, window and wall units and portable units count as individual units. Heat pumps appear here only as cooling equipment; heating shares are covered in our heat pump sales report.
In 2020, 67% of US homes used central air and 89% used some form of air conditioning (EIA, RECS 2020 state highlights). Florida led at 90.4%, followed by South Carolina at 86.4%, Tennessee at 85.8% and Arizona at 85.7% (our tabulation of the RECS 2020 microdata, which rounds to EIA's published figures).
Share of occupied homes using central AC or a central heat pump (main or secondary)
Source: EIA RECS 2020 microdata; HVAC Business Brokers Research Desk tabulation. Alaska withheld (RSE above 50%).
At the other end, central air reached 7.5% of homes in Vermont, 9.6% in Maine and 11.6% in Hawaii. New York (29.3%) and Washington (29.5%) are the two most populous states where fewer than a third of homes use central air. Texas sits at 83.0% and California at 53.7%.
Show all 52 rows
| State | Occupied homes, 2025 (ACS) | Any AC, % (RECS 2020) | Central AC, % (RECS 2020) | Individual units, % (RECS 2020) | No AC, % (RECS 2020) | No AC, % (Census LACE 2023) | Homes without central AC, 2025 (thousands, our estimate) | Rank: most homes without central AC | Central AC systems 15+ years old, % (RECS 2020) |
|---|---|---|---|---|---|---|---|---|---|
| Florida | 9326796 | 95.8 | 90.4 | 10.8 | 4.2 | 0.5 | 898 | 13 | 12.8 |
| South Carolina | 2296350 | 95.1 | 86.4 | 17.7 | 4.9 | 1.1 | 313 | 32 | 18.2 |
| Tennessee | 2954096 | 93.5 | 85.8 | 16.5 | 6.5 | 1.8 | 421 | 28 | 19.9 |
| Arizona | 3040935 | 94.2 | 85.7 | 12.3 | 5.8 | 2.0 | 436 | 27 | 16.6 |
| Nebraska | 827249 | 94.7 | 85.6 | 14.0 | 5.3 (RSE above 30%) | 0.9 | 119 | 48 | 34.6 |
| Georgia | 4269857 | 95.2 | 85.5 | 18.2 | 4.8 | 0.9 | 618 | 18 | 19.3 |
| Kansas | 1205638 | 93.2 | 85.1 | 14.6 | 6.8 | 1.4 | 179 | 45 | 21.9 |
| Delaware | 422123 | 97.0 | 85.0 | 19.4 | 3.0 (RSE above 30%) | 0.5 | 63 | 51 | 19.9 |
| North Carolina | 4539531 | 90.6 | 84.5 | 11.5 | 9.4 | 2.7 | 705 | 17 | 19.7 |
| Kentucky | 1885581 | 94.9 | 83.9 | 18.8 | 5.1 | 2.2 | 304 | 34 | 21.0 |
| Oklahoma | 1616177 | 96.0 | 83.2 | 19.7 | 4.0 (RSE above 30%) | 0.5 | 271 | 40 | 19.2 |
| Texas | 11607274 | 95.0 | 83.0 | 16.3 | 5.0 | 1.0 | 1973 | 5 | 16.5 |
| Missouri | 2604619 | 95.2 | 82.9 | 19.2 | 4.8 (RSE above 30%) | 0.9 | 445 | 25 | 29.0 |
| Virginia | 3480219 | 94.6 | 82.5 | 17.1 | 5.4 | 1.8 | 608 | 19 | 22.0 |
| Alabama | 2070835 | 93.5 | 81.5 | 20.4 | 6.5 | 0.8 | 384 | 30 | 15.7 |
| Iowa | 1355504 | 97.2 | 81.1 | 22.2 | 2.8 (RSE above 30%) | 1.1 | 256 | 42 | 32.7 |
| Indiana | 2816686 | 94.3 | 80.7 | 20.1 | 5.7 | 1.1 | 543 | 21 | 23.1 |
| Maryland | 2428843 | 91.4 | 79.9 | 20.4 | 8.6 | 1.7 | 489 | 22 | 24.8 |
| Mississippi | 1197317 | 92.9 | 79.3 | 24.1 | 7.1 (RSE above 30%) | 1.1 | 248 | 44 | 22.9 |
| Utah | 1208124 | 91.9 | 79.2 | 13.9 | 8.1 | 8.2 | 252 | 43 | 21.5 |
| Nevada | 1245703 | 92.0 | 78.0 | 13.9 | 8.0 | 3.9 | 275 | 38 | 27.6 |
| South Dakota | 387580 | 92.0 | 76.4 | 18.8 | 8.0 | 4.6 | 91 | 50 | 29.4 |
| Louisiana | 1855847 | 92.6 | 75.7 | 25.4 | 7.4 | 0.9 | 451 | 24 | 20.9 |
| Illinois | 5134283 | 96.0 | 73.9 | 28.2 | 4.0 | 1.8 | 1341 | 9 | 25.9 |
| Ohio | 4957873 | 93.5 | 73.7 | 26.1 | 6.5 | 3.6 | 1306 | 10 | 30.5 |
| Arkansas | 1277805 | 93.4 | 72.5 | 26.4 | 6.6 | 2.6 | 352 | 31 | 22.6 |
| Minnesota | 2391870 | 94.3 | 68.5 | 29.0 | 5.7 | 3.9 | 754 | 16 | 34.7 |
| District of Columbia | 333195 | 93.3 | 68.0 | 30.0 | 6.7 | 1.8 | 107 | 49 | 32.0 |
| Wisconsin | 2567583 | 92.4 | 67.2 | 28.9 | 7.6 | 7.7 | 841 | 15 | 33.6 |
| Michigan | 4150990 | 86.6 | 66.5 | 26.6 | 13.4 | 8.6 | 1392 | 7 | 31.6 |
| Idaho | 765200 | 80.6 | 63.8 | 18.8 | 19.4 | 9.3 | 277 | 36 | 30.7 |
| West Virginia | 747801 | 89.1 | 63.6 | 33.4 | 10.9 | 8.2 | 272 | 39 | 19.1 |
| New Jersey | 3565008 | 96.5 | 61.1 | 42.2 | 3.5 | 1.1 | 1385 | 8 | 25.9 |
| North Dakota | 352013 | 92.9 | 58.1 | 37.2 | 7.1 | 2.1 | 147 | 47 | 31.6 |
| Colorado | 2483142 | 81.7 | 56.8 | 20.4 | 18.3 | 13.4 | 1073 | 11 | 24.7 |
| California | 13898622 | 72.4 | 53.7 | 23.1 | 27.6 | 21.4 | 6430 | 1 | 29.7 |
| Pennsylvania | 5405581 | 90.8 | 53.5 | 43.3 | 9.2 | 5.7 | 2514 | 3 | 27.8 |
| New Mexico | 863010 | 85.0 | 53.0 | 14.1 | 15.0 | 14.1 | 406 | 29 | 19.8 |
| Oregon | 1745361 | 76.3 | 49.1 | 30.4 | 23.7 | 18.1 | 889 | 14 | 26.6 |
| Montana | 481275 | 65.1 | 40.1 | 30.0 | 34.9 | 27.0 | 288 | 35 | 20.5 |
| Wyoming | 256608 | 70.7 | 39.8 | 23.4 | 29.3 | 21.1 | 154 | 46 | 25.7 |
| Connecticut | 1456915 | 89.6 | 34.0 | 60.3 | 10.4 | 5.1 | 962 | 12 | 35.9 |
| Massachusetts | 2827794 | 87.2 | 32.1 | 57.8 | 12.8 | 5.9 | 1921 | 6 | 29.6 |
| Rhode Island | 450467 | 90.0 | 31.2 | 64.8 | 10.0 | 8.4 | 310 | 33 | 29.9 |
| Washington | 3180129 | 52.5 | 29.5 | 24.6 | 47.5 | 34.2 | 2242 | 4 | 26.7 |
| New York | 7867612 | 87.7 | 29.3 | 61.1 | 12.3 | 9.8 | 5561 | 2 | 30.2 |
| New Hampshire | 574089 | 77.7 | 21.1 | 58.9 | 22.3 | 12.8 | 453 | 23 | 23.0 (RSE above 30%) |
| Hawaii | 500883 | 57.0 | 11.6 | 47.5 | 43.0 | 43.4 | 443 | 26 | 25.2 (RSE above 30%) |
| Maine | 620759 | 70.5 | 9.6 | 62.9 | 29.6 | 18.3 | 561 | 20 | withheld (RSE above 50%) |
| Vermont | 285750 | 67.0 | 7.5 | 60.3 | 33.0 | 27.2 | 264 | 41 | 26.0 (RSE above 30%) |
| Alaska | 278920 | 6.9 | withheld (RSE above 50%) | 6.1 | 93.1 | 93.0 | 277 | 37 | withheld (RSE above 50%) |
| United States | 134063422 | 88.7 | 67.3 | 26.2 | 11.3 | 6.9 | 43839 | 23.3 |
Sorted by central AC share. RECS 2020 shares are our weighted tabulation of EIA microdata and round to EIA's published state percentages. Central AC includes central heat pumps and counts main or secondary equipment. Homes without central AC = (1 minus RECS 2020 central share) x ACS 2025 occupied units. RSE flags follow EIA practice: above 50% withheld, above 30% use with caution.
Source: [1][3][17][19] U.S. Energy Information Administration; U.S. Energy Information Administration; U.S. Census Bureau; U.S. Census Bureau
Central air went from one in three US homes in 1985 to nearly three in four in 2023
Our tabulation of 40 years of American Housing Survey microdata shows central air passing half of occupied homes in 1997 and climbing every survey since, while homes with no AC fell by more than two thirds as a share.
In 1985, 33.3% of occupied US homes had central air, 29.4% relied on room units and 37.3% had no air conditioning, about 33.0 million homes (our tabulation of the AHS 1985 national public use file). By 1997 central air reached 50.2%. In 2023 it reached 73.9%, or 98,439 thousand of 133,231 thousand occupied units (Census AHS 2023, Table C-03-AO).
American Housing Survey, percent of occupied units
Source: Census/HUD American Housing Survey; 1985 to 2015 our microdata tabulation, 2017 to 2023 Census Table Creator.
That is a gain of 40.6 percentage points and 69.0 million homes with central air over 38 years. The room-unit share barely moved, from 29.4% to 19.2%: most of the growth came from homes that had no AC at all and from new construction, which the AHS counts as it enters the stock.
| Year | Occupied units (thousands) | Central AC (thousands) | Room units only (thousands) | No AC (thousands) | Central AC, % | Room units, % | No AC, % | Basis |
|---|---|---|---|---|---|---|---|---|
| 1985 | 88425 | 29447 | 26011 | 32967 | 33.3 | 29.4 | 37.3 | Our PUF tabulation |
| 1989 | 93684 | 37554 | 27209 | 28921 | 40.1 | 29.0 | 30.9 | Our PUF tabulation |
| 1993 | 94724 | 42182 | 26090 | 26451 | 44.5 | 27.5 | 27.9 | Our PUF tabulation |
| 1997 | 99487 | 49896 | 26134 | 23458 | 50.2 | 26.3 | 23.6 | Our PUF tabulation |
| 2001 | 106261 | 60118 | 26562 | 19580 | 56.6 | 25.0 | 18.4 | Our PUF tabulation |
| 2005 | 108855 | 67687 | 24855 | 16313 | 62.2 | 22.8 | 15.0 | Our PUF tabulation |
| 2009 | 111806 | 72808 | 24582 | 14416 | 65.1 | 22.0 | 12.9 | Our PUF tabulation |
| 2013 | 115852 | 77315 | 25270 | 13267 | 66.7 | 21.8 | 11.5 | Our PUF tabulation |
| 2015 | 118290 | 79907 | 25326 | 13057 | 67.6 | 21.4 | 11.0 | Our PUF tabulation |
| 2017 | 121600 | 84480 | 25400 | 11670 | 69.5 | 20.9 | 9.6 | Census Table Creator |
| 2019 | 124135 | 88632 | 24628 | 10875 | 71.4 | 19.8 | 8.8 | Census Table Creator |
| 2021 | 128504 | 93098 | 25704 | 9703 | 72.4 | 20.0 | 7.6 | Census Table Creator |
| 2023 | 133231 | 98439 | 25588 | 9204 | 73.9 | 19.2 | 6.9 | Census Table Creator |
1985 to 2015: our weighted tabulation of AHS national public use files (2013 matches Census's published 77,315 thousand). 2017 to 2023: Census Table Creator estimates. AHS counts evaporative coolers as central AC and redesigned its sample and AC questions in 2015.
Source: [15][14][13][12][11][10] U.S. Census Bureau and HUD; U.S. Census Bureau and HUD; U.S. Census Bureau and HUD; U.S. Census Bureau and HUD; U.S. Census Bureau and HUD; U.S. Census Bureau and HUD
43.8 million US homes do not use central air, and five states hold 43% of them
Applying each state's 2020 central AC share to its 2025 occupied housing count gives the number of homes that cool with room units, mini-splits or nothing at all. Population, not climate, drives the ranking.
Our estimate: 43.8 million of the 134.1 million occupied US homes counted by the 2025 American Community Survey did not use central air, assuming the RECS 2020 share held. California leads with about 6,430 thousand homes, then New York (5,561 thousand), Pennsylvania (2,514 thousand), Washington (2,242 thousand) and Texas (1,973 thousand). Those five states hold 18.7 million homes, 43.3% of the 51-state total.
Thousands of occupied homes that do not use central AC (top 20 states)
Source: HVAC Business Brokers Research Desk estimate from EIA RECS 2020 shares and Census ACS 2025 1-year occupied units.
Texas makes the list despite an 83.0% central share because it has 11.6 million occupied homes. Florida, at 90.4% central, still has about 898 thousand homes without a central system.
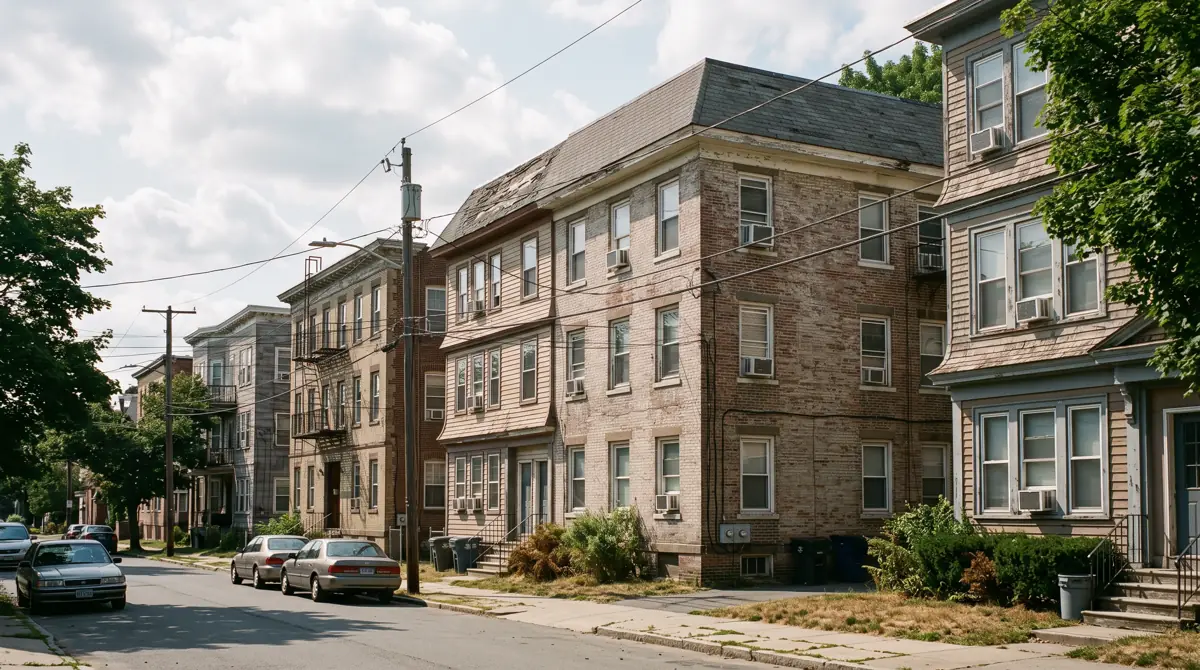
In 13 states, central air is the exception rather than the rule
Thirteen states use central air in fewer than half of their homes. Together they hold one in three of the nation's homes without central air.
- Alaska: withheld by EIA (RSE above 50%)
- Vermont: 7.5%
- Maine: 9.6%
- Hawaii: 11.6%
- New Hampshire: 21.1%
- New York: 29.3%
- Washington: 29.5%
- Rhode Island: 31.2%
- Massachusetts: 32.1%
- Connecticut: 34.0%
- Wyoming: 39.8%
- Montana: 40.1%
- Oregon: 49.1%
These 13 states have 20.5 million occupied homes in 2025 and an estimated 14.3 million homes without central air, 33.1% of the national total. In New England and New York, individual units dominate: 60.3% of Connecticut homes and 61.1% of New York homes used window, wall, portable or mini-split units in 2020. In Washington, Hawaii and Alaska the larger group is homes with no AC.
Renters and small apartment buildings are least likely to have central air
Housing type and tenure split the market almost as sharply as geography.
In 2020, 75.3% of single-family detached homes used central air, against 53.3% of apartments in buildings of five or more units and 41.0% in buildings of two to four units. Mobile homes stood at 58.0%. Owners used central air in 74.7% of homes and renters in 52.1%; 16.5% of renter homes used no AC, against 8.8% of owner homes (our tabulation of RECS 2020 microdata).
| Group | Category | Homes (million) | Any AC, % | Central AC, % | Individual units, % | No AC, % | Central AC 15+ years old, % |
|---|---|---|---|---|---|---|---|
| Housing type | Mobile home | 6.83 | 88.8 | 58.0 | 38.6 | 11.2 | 19.4 |
| Housing type | Single-family detached | 77.07 | 90.5 | 75.3 | 21.4 | 9.5 | 21.6 |
| Housing type | Single-family attached | 7.45 | 88.2 | 69.4 | 23.4 | 11.8 | 21.8 |
| Housing type | Apartment, 2 to 4 units | 9.34 | 81.0 | 41.0 | 42.4 | 19.0 | 14.5 |
| Housing type | Apartment, 5 or more units | 22.84 | 85.7 | 53.3 | 33.4 | 14.3 | 36.5 |
| Tenure | Owned | 82.92 | 91.2 | 74.7 | 22.5 | 8.8 | 22.6 |
| Tenure | Rented | 39.37 | 83.5 | 52.1 | 33.9 | 16.5 | 25.2 |
Our weighted tabulation of RECS 2020 microdata. Central AC 15+ years old is the share of homes whose MAIN equipment is central AC with a reported age of 15 years or more.
Source: [3][2] U.S. Energy Information Administration; U.S. Energy Information Administration
Large apartment buildings also have the oldest central systems: 36.5% of central AC in buildings of five or more units was 15 or more years old, against 21.6% in single-family detached homes.
Nearly one in four central AC systems was 15 or older in 2020, and cooler states keep theirs longest
Of the 82.69 million homes whose main cooling was central AC in 2020, 19.3 million had a system 15 or more years old. The share is highest in the cooler northern divisions and lowest in the hot South.
In 2020, 23.3% of central AC systems in US homes were 15 or more years old and 11.5% were 20 or more (our tabulation of RECS 2020 microdata). Another 17.12 million systems were 10 to 14 years old; any of them still running in 2025 has crossed 15. The median system fell in the 5 to 9 year band: 55.9% were under 10 years old.
Share of homes whose main cooling is central AC, by reported system age
Source: EIA RECS 2020 microdata; HVAC Business Brokers Research Desk tabulation.
| Age of central AC system | Homes (million) | Share of central AC homes, % | RSE of count, % |
|---|---|---|---|
| Less than 2 years | 10.76 | 13.0 | 2.7 |
| 2 to 4 years | 13.49 | 16.3 | 2.4 |
| 5 to 9 years | 22.03 | 26.6 | 1.6 |
| 10 to 14 years | 17.12 | 20.7 | 2.2 |
| 15 to 19 years | 9.83 | 11.9 | 3.0 |
| 20 years or more | 9.47 | 11.5 | 3.2 |
| All central AC homes (main equipment) | 82.69 | 100.0 | 0.5 |
Homes whose main cooling equipment is central AC or a central heat pump (82.69 million). Age bands as reported by the household. RSE is the relative standard error of the count.
Source: [3] U.S. Energy Information Administration
By division, the West North Central (30.5%) and New England (30.4%) had the largest shares of central systems 15 or more years old; the West South Central (17.7%) and South Atlantic (18.0%) had the smallest. Across 42 states with reliable estimates, the share of old systems falls as cooling degree days rise (correlation of -0.69). Florida's share was 12.8%; Minnesota's was 34.7%.
Percent of homes whose main cooling is central AC
Source: EIA RECS 2020 microdata; HVAC Business Brokers Research Desk tabulation.
| Census division | Homes (million) | Central AC, % | No AC, % | Central AC 10+ years old, % | Central AC 15+ years old, % | Average cooling degree days (30-year normal) |
|---|---|---|---|---|---|---|
| West North Central | 8.5 | 78.2 | 5.3 | 52.5 | 30.5 | 1012 |
| New England | 5.88 | 28.2 | 15.4 | 50.4 | 30.4 | 575 |
| Pacific | 18.51 | 47.7 | 31.7 | 49.4 | 29.1 | 969 |
| East North Central | 18.55 | 72.4 | 7.3 | 49.7 | 28.7 | 805 |
| Middle Atlantic | 16.04 | 43.8 | 9.4 | 48.3 | 28.0 | 851 |
| Mountain North | 4.62 | 60.4 | 18.3 | 46.6 | 24.4 | 711 |
| Mountain South | 4.6 | 78.2 | 7.9 | 38.7 | 19.7 | 2827 |
| East South Central | 7.38 | 83.3 | 6.3 | 38.6 | 19.5 | 1657 |
| South Atlantic | 24.84 | 85.2 | 6.0 | 38.8 | 18.0 | 2158 |
| West South Central | 14.62 | 81.3 | 5.3 | 38.8 | 17.7 | 2606 |
Our weighted tabulation of RECS 2020 microdata. Cooling degree days are EIA's 30-year normals (base 65F), weighted by homes; EIA perturbs this field slightly for privacy.
Source: [3][5] U.S. Energy Information Administration; U.S. Energy Information Administration
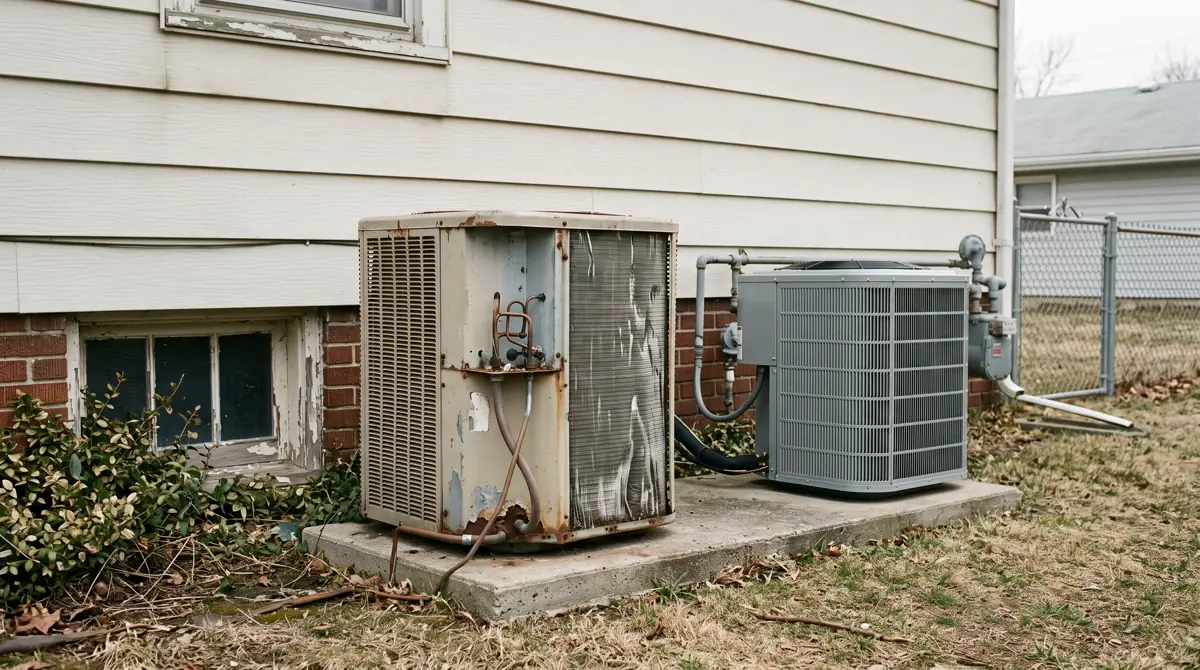
Why one federal source says 11.3% of homes lack AC and another says 6.9%
RECS counts homes that used AC equipment in 2020; the AHS and the Census LACE model count homes that have working AC. The gap is 4.4 points nationally and wider in mild states.
RECS 2020 puts US homes without air conditioning at 11.3%. The Census Bureau's 2023 Local Air Conditioning Estimates put them at 6.9%, or 8,807,334 households, matching the AHS 2023 share of 6.9%. LACE is an experimental model that applies the AHS question to American Community Survey records.
| Source | What it measures | Year | Any AC, % | No AC, % | Central AC, % | Notes |
|---|---|---|---|---|---|---|
| EIA RECS 2020 | Household used AC equipment in 2020 | 2020 | 88.7 | 11.3 | 67.3 | Survey of 18,496 homes; state estimates |
| Census AHS 2023 | Unit has working AC (primary) | 2023 | 93.1 | 6.9 | 73.9 | National survey; central includes evaporative coolers |
| Census LACE 2023 | Modeled from AHS 2023 onto ACS 2019 to 2023 | 2023 | 93.1 | 6.9 | not published | Experimental model; state, county, tract |
| EIA RECS 2024 | Unable to use AC at some point in past 12 months | 2024 | not yet released (spring 2027) | not yet released | not yet released | 8.16 million homes could not use AC at some point |
The measures answer different questions and cannot be subtracted from each other without care.
Source: [1][10][19][8][7] U.S. Energy Information Administration; U.S. Census Bureau and HUD; U.S. Census Bureau; U.S. Energy Information Administration; U.S. Energy Information Administration
In 17 states the RECS no-AC share exceeds the LACE share by more than 5 points. Washington shows 47.5% in RECS 2020 and 34.2% in LACE 2023; Alabama shows 6.5% and 0.8%. A home that owns a window unit but did not run it counts as having AC in the AHS and as not using it in RECS.
What the central air map means for an HVAC contractor
The data describe two different service markets: replacement of an aging ducted fleet in the South and Midwest, and first-time cooling in the Northeast and West.
- Sunbelt operators work in states where 81.5% to 90.4% of homes already use central air, so revenue depends on replacement cycles. Their fleets are younger: 12.8% of Florida central systems were 15 or older in 2020.
- Northern operators face older fleets: 30.5% of central systems in the West North Central division were 15 or older, which points to replacement work concentrated in a shorter cooling season.
- Northeast and Pacific Northwest operators sell into homes that mostly lack ducts: 43.8 million homes nationally do not use central air, and New York alone accounts for about 5,561 thousand.
- Affordability limits the replacement pool: in 2024, 6.88 million homes (5.2%) could not use their AC at some point because it was broken and they could not afford repair or replacement (our tabulation of RECS 2024 microdata).
For owners weighing how these markets affect a sale, see our guide to selling an HVAC business.
State-by-state findings
- 67% of US homes (83.16 million of 123.53 million) used central air conditioning or a central heat pump in 2020 (EIA RECS 2020).[1]
- 89% of US homes used some form of air conditioning in 2020, and 11.3% (14.02 million) used none (EIA RECS 2020).[1][3]
- 26% of US homes (32.42 million) used window, wall, portable or mini-split units in 2020 (EIA RECS 2020).[1]
- Florida had the highest central air share in 2020 at 90.4%; Vermont the lowest published share at 7.5% (RECS 2020 microdata).[3]
- 13 states used central air in fewer than half of their homes in 2020 (RECS 2020 microdata).[3]
- 43.8 million US homes did not use central air in 2025, by our estimate from RECS 2020 shares and ACS 2025 occupied units.[3][17]
- California had about 6,430 thousand homes without central air in 2025 and New York about 5,561 thousand (our estimate).[3][17]
- Central air reached 73.9% of occupied US homes in the 2023 American Housing Survey, up from 33.3% in 1985 (AHS).[10][15]
- Occupied US homes without AC fell from 37.3% in 1985 to 6.9% in 2023 (AHS).[15][10]
- 23.3% of central AC systems in US homes (19.3 million) were 15 or more years old in 2020 (RECS 2020 microdata).[3]
- 30.5% of central AC systems in the West North Central division were 15 or more years old in 2020, against 17.7% in the West South Central (RECS 2020 microdata).[3]
- Renters used central air in 52.1% of homes in 2020, owners in 74.7% (RECS 2020 microdata).[3]
- The Census Bureau's 2023 Local Air Conditioning Estimates put US households without any AC at 6.9% (8,807,334).[19]
- 6.88 million US homes (5.2%) could not use their AC at some point in 2024 because it was broken and repair was unaffordable (RECS 2024 microdata).[9][8]
Rankings and ratios we derived
Homes without central air by state, 2025 (signature figure)
Formulahomes_without_central(state) = (1 - central_share_RECS2020(state)) x occupied_units_ACS2025(state)
Inputs: RECS 2020 microdata state central shares (t1; derived rows d_nocentral_*); ACS 2025 B25002 fact rows acs_* (fact sheet rows)
Result: 43.8 million US homes; California 6,430 thousand, New York 5,561 thousand, Pennsylvania 2,514 thousand, Washington 2,242 thousand, Texas 1,973 thousand; top five hold 43.3% of the 51-state sum of 43.3 million
The non-central market is concentrated in large coastal states, not hot ones.
Limitations: Holds each state's 2020 share fixed; homes built or converted since 2020 are not reflected. State shares carry sampling error (central share RSE up to 24.8% among published states).
States where under half of homes use central air
Formulacount(central_share_RECS2020 < 50%); sum ACS 2025 occupied units and d1 across those states
Inputs: t1; derived rows d_under_half_* (fact sheet rows)
Result: 13 states; 20.5 million occupied homes; 14.3 million without central air (33.1% of the national total)
One third of homes without central air sit in the 13 states where central air is the minority choice.
Limitations: Oregon (49.1%) is within sampling error of 50%.
Central air trend from AHS microdata, 1985 to 2015
Formulashare(category, year) = sum WEIGHT over ISTATUS=1 and category / sum WEIGHT over ISTATUS=1
Inputs: AHS national PUFs 1985, 1989, 1993, 1997, 2001, 2005, 2009, 2013, 2015 (s15); validation fact row ahs2013_central_pub (fact sheet rows)
Result: Central AC 33.3% (1985), 50.2% (1997), 66.7% (2013), 73.9% (2023); change of 40.6 points
Central air passed half of occupied homes in 1997.
Limitations: AHS changed its sample in 2015 and its AC questions in 2015; evaporative coolers count as central.
Central AC age profile
Formulashare_15plus = homes(central main, age 15+) / homes(central main)
Inputs: RECS 2020 microdata ACEQUIPM_PUB and ACEQUIPAGE (s3); derived rows d_cage_*, d_central_main_* (fact sheet rows)
Result: 19.3 million systems (23.3%) 15+ years old; 36.42 million (44.0%) 10+ years old; 9.47 million (11.5%) 20+
A large share of the ducted fleet was already past typical replacement age in 2020.
Limitations: Age is reported by the household and refers to main equipment only.
Cooling load and system age
FormulaPearson r between weighted mean 30-year cooling degree days and share of central AC 15+ years old, by state
Inputs: RECS 2020 microdata (CDD30YR_PUB, ACEQUIPAGE); 42 states with at least 100 central AC sample homes and RSE at or below 30% (fact sheet rows)
Result: r = -0.69
Hotter states have younger central AC fleets, consistent with more run hours and faster replacement.
Limitations: Correlation, not cause; housing age and household turnover also differ by state.
Gap between the 'uses' and 'has' measures of no AC
Formulagap = no_AC_share_RECS2020 - no_AC_share_LACE2023
Inputs: t1; derived rows d_gap_* (fact sheet rows)
Result: 4.4 points nationally (11.3% vs 6.9%); above 5 points in 17 states
Mild-climate states have many homes with AC equipment they did not use in 2020.
Limitations: Different years (2020 vs 2023) and a modeled LACE estimate.
Executive summary
- 67% of US homes used central air in 2020 and 89% used some form of AC (EIA RECS 2020).
- State shares range from 90.4% in Florida to 7.5% in Vermont; 13 states are below half.
- We estimate 43.8 million US homes did not use central air in 2025; California, New York, Pennsylvania, Washington and Texas hold 43.3% of them.
- AHS microdata show central air rising from 33.3% of occupied homes in 1985 to 73.9% in 2023.
- 19.3 million central AC systems (23.3%) were 15 or more years old in 2020, with older fleets in cooler divisions.
- Renters (52.1%) and small apartment buildings (41.0%) lag owners (74.7%) on central air.
- Federal no-AC estimates differ (11.3% in RECS 2020, 6.9% in AHS and LACE 2023) because they ask different questions.
Questions people ask
What percentage of homes have central air?
67% of US homes used central air conditioning or a central heat pump in 2020 (EIA RECS 2020). The American Housing Survey, which counts homes that have working central AC including evaporative coolers, puts it at 73.9% of occupied homes in 2023.
Which states have the most homes without air conditioning?
By count, California (2,873,171 households), Washington (1,033,388) and New York (751,009) had the most households without any AC in the Census Bureau's 2023 LACE estimates. By share, Alaska (93.0%), Hawaii (43.4%) and Washington (34.2%) led.
How old is the average air conditioner?
RECS reports age in bands, not an average. In 2020 the median central AC system in US homes was 5 to 9 years old: 55.9% were under 10, 23.3% were 15 or older and 11.5% were 20 or older (our tabulation of RECS 2020 microdata).
Download the data
Every table in this report is available as a CSV under CC BY 4.0. The fact sheet lists each value with its source URL and access date.
- derived_metrics.csv (CSV)
- fact_sheet.csv (CSV)
- t1_state_atlas.csv (CSV)
- t2_ahs_trend_1985_2023.csv (CSV)
- t3_type_tenure.csv (CSV)
- t4_central_ac_age.csv (CSV)
- t5_division_age.csv (CSV)
- t6_measures_compared.csv (CSV)
For journalists and researchers
If you cite only a few, cite these
- 67% of US homes used central air in 2020 (EIA RECS 2020).[1]
- 43.8 million US homes did not use central air in 2025 (HVAC Business Brokers Research Desk estimate).[3][17]
- 23.3% of US central AC systems were 15 or more years old in 2020 (RECS 2020 microdata).[3]
Most quotable statistics
- 67% of US homes used central air or a central heat pump in 2020, according to EIA's Residential Energy Consumption Survey.[1]
- An estimated 43.8 million US homes did not use central air in 2025 (HVAC Business Brokers Research Desk, from EIA RECS 2020 and Census ACS 2025).[3][17]
- Central air reached 73.9% of occupied US homes in 2023, up from 33.3% in 1985 (American Housing Survey).[10][15]
- Florida led the nation in 2020 with 90.4% of homes using central air; Vermont had 7.5%.[3]
- 19.3 million US central air conditioners, 23.3% of the fleet, were 15 or more years old in 2020.[3]
- In 13 states, fewer than half of homes used central air in 2020.[3]
Press summary
67% of US homes used central air conditioning or a central heat pump in 2020, according to the Energy Information Administration, with state shares ranging from 90.4% in Florida to 7.5% in Vermont. Applying those state shares to 2025 Census housing counts, the HVAC Business Brokers Research Desk estimates that 43.8 million US homes do not use central air, led by California and New York. American Housing Survey microdata show central air rising from 33.3% of occupied homes in 1985 to 73.9% in 2023, while 23.3% of central systems in use in 2020 were 15 or more years old.
Suggested headlines
- Two in three US homes use central air; Florida leads at 90.4%
- 43.8 million American homes still lack central air, led by California and New York
- Central air in US homes climbed from 33.3% to 73.9% between 1985 and 2023
- In 13 states, fewer than half of homes use central air
- 19.3 million central AC systems were at least 15 years old in 2020
How to cite this report
HVAC Business Brokers. (2026). Percentage of Homes With Central Air: 67% Nationally, 90.4% in Florida, 7.5% in Vermont. Retrieved from https://sell-my-hvac-business.com/research/percentage-of-homes-with-central-air/
Reuse license
Data and tables are licensed CC BY 4.0. Attribution: “Source: HVAC Business Brokers, Percentage of Homes With Central Air: 67% Nationally, 90.4% in Florida, 7.5% in Vermont” with a link to this page.
Frequently asked questions
How many US homes have central air?
83.16 million of 123.53 million US homes used central air or a central heat pump in 2020 (EIA RECS 2020). The AHS counted 98,439 thousand occupied homes with central air in 2023.
Does central air include heat pumps?
Yes. In RECS, central air includes central (ducted) heat pumps used for cooling. Ductless mini-splits are counted as individual units; 2.1% of US homes used one in 2020.
Which state has the highest percentage of homes with central air?
Florida, at 90.4% of homes in 2020 (RECS 2020 microdata; EIA publishes 90%).
Which state has the lowest percentage of homes with central air?
Among published estimates, Vermont at 7.5% in 2020, followed by Maine at 9.6% and Hawaii at 11.6%. EIA withholds Alaska's estimate because its sampling error is too large.
What percentage of US homes have no air conditioning?
11.3% of US homes used no air conditioning in 2020 (RECS). Measured as homes that have no working AC, the share was 6.9% in 2023 (AHS and Census LACE).
How has central air changed since 1985?
Central air rose from 33.3% of occupied homes in 1985 to 73.9% in 2023, a gain of 40.6 percentage points (AHS).
Do renters have central air less often than owners?
Yes. In 2020, 52.1% of renter homes used central air against 74.7% of owner homes, and 16.5% of renter homes used no AC (RECS 2020 microdata).
How many central AC systems are 15 years or older?
19.3 million in 2020, 23.3% of homes whose main cooling was central AC (RECS 2020 microdata).
How many homes in New York lack central air?
About 5,561 thousand New York homes did not use central air in 2025, by our estimate; 29.3% of New York homes used central air in 2020.
When will newer state data on central air be released?
EIA says RECS 2024 air conditioning tables will be released in spring 2027. Until then RECS 2020 is the latest state-level source for central air.
Reproduce this analysis
Every figure comes from the files below. The scripts that pulled and computed them are kept with the report and can be re-run.
| Dataset | Publisher | Source | Query or filter | Rows used | Retrieved |
|---|---|---|---|---|---|
| RECS 2020 public microdata v7 | EIA | File or endpoint | state_postal, AIRCOND, ACEQUIPM_PUB, ACEQUIPAUXTYPE_PUB, ACEQUIPAGE, TYPEHUQ, KOWNRENT, DIVISION, CDD30YR_PUB, NWEIGHT, NWEIGHT1 to NWEIGHT60 | 18,496 households, all used | 2026-11-02 |
| RECS 2020 state air conditioning highlights and HC7.1 | EIA | File or endpoint | data and rse sheets, 51 states plus US | 52 rows | 2026-11-02 |
| AHS national public use files 1985 to 2015 | Census Bureau and HUD | File or endpoint | ISTATUS/INTSTATUS = 1; AIR, AIRSYS (1985 to 2013); ACPRIMARY (2015); WEIGHT or WGT90GEO | 9 survey years; all occupied interviewed units | 2026-11-02 |
| AHS Table C-03-AO estimates 2017 to 2023 | Census Bureau and HUD | File or endpoint | Heating, AC, Appliances sheet; Total and ACPRIMARY rows | 4 years x 5 rows | 2026-11-02 |
| ACS 2025 1-year summary file B25002 | Census Bureau | File or endpoint | B25002_E002 occupied units; GEO_ID 0100000US and 0400000US (Puerto Rico excluded) | 51 states plus US | 2026-11-02 |
| 2023 Local Air Conditioning Estimates, state and national files | Census Bureau | File or endpoint | NO_AC_E, NO_AC_PE, AC_PE | 51 states plus US | 2026-11-02 |
| RECS 2024 public microdata v1 and Table HC11.1 | EIA | File or endpoint | NOACBROKE, NOACEL, NWEIGHT, NWEIGHT1 to NWEIGHT60 | 16,676 households | 2026-11-02 |
Data quality and exclusions
- RECS 2020 microdata: 18,496 records, 0 excluded. Our state shares round to all 152 published, non-withheld state cells in EIA's state AC table (any AC, central, individual); 1 cell (Alaska central) is withheld by EIA and shown as withheld here.
- 6 states have a no-AC share with RSE above 30% and are flagged in table t1; Alaska's central share (RSE 56.6%) and Maine's and Alaska's 15+ age shares (RSE above 50%) are withheld.
- AHS public use files: at least one older CSV file contains NUL bytes, which we stripped before parsing; the 2013 result still equals the published table. 0 occupied units had a missing AC code in any of the 9 years tabulated.
- AHS 2013 validation: our central AC tabulation (77,315 thousand) equals the Census published table; 2017 to 2023 PUF estimates equal Table Creator values except 2017, where Census rounds to 4 significant digits.
- ACS 2025: Puerto Rico (1 row) excluded because RECS and LACE cover the 50 states and DC only.
- RECS 2024 microdata: 16,676 records; our total of homes unable to use AC (8.16 million) equals EIA Table HC11.1.
Methodology
Source selection: we used only federal statistical sources for figures: EIA's Residential Energy Consumption Survey (RECS 2020 final, March 2023; RECS 2024 preliminary, March 2026), the Census/HUD American Housing Survey (1985 to 2023), the Census American Community Survey 2025 1-year estimates (released October 29, 2026) and the Census Bureau's 2023 Local Air Conditioning Estimates (released May 19, 2026). Trade press and consumer sites were read only to check what is already published.
State shares: we tabulated the RECS 2020 public microdata (18,496 homes) with the final weight NWEIGHT and computed standard errors with the 60 jackknife replicate weights, variance = (59/60) x sum of squared replicate deviations, as EIA's microdata guide specifies. Our state percentages round to every published value in EIA's state air conditioning table, and our RSEs match EIA's published RSEs.
Definitions: central AC means main or secondary equipment is a central air conditioner or central heat pump (ACEQUIPM_PUB or ACEQUIPAUXTYPE_PUB = 1). No AC means AIRCOND = 0. System age refers to main equipment (ACEQUIPAGE) and is reported only for homes whose main equipment is central.
Trend: for 1985 to 2015 we tabulated AHS national public use files: occupied units are ISTATUS = 1 (INTSTATUS = 1 in 2015); central AC is AIRSYS = 1, room units AIR = 1 without central, and none otherwise (ACPRIMARY codes in 2015). Weights are WEIGHT (1985 to 1997, 2015) and WGT90GEO (2001 to 2013). Our 2013 central AC total equals the published 77,315 thousand. 2017 to 2023 use Census Table Creator estimates.
Signature estimate: homes without central AC in 2025 = (1 minus the state's RECS 2020 central share) x the state's ACS 2025 occupied housing units (B25002_002). The national figure uses the national share; the state figures sum to 43.3 million.
Conflicts: RECS (uses AC), AHS and LACE (has working AC) measure different things. We report each separately and never subtract across sources except in the explicitly labelled gap metric.
Last updated 2026-11-02. Data and tables are licensed CC BY 4.0. Owners who want a figure for their own company can use the valuation form.
This report presents published data with its limitations. It is not legal, financial or investment advice.
Sources, ranked by quality
Tier 1: primary and official sources (22)
- [1] U.S. Energy Information Administration. RECS 2020: Highlights for air conditioning in U.S. homes by state, 2020 (final release March 2023). 2020. Accessed 2026-11-02.
- [2] U.S. Energy Information Administration. RECS 2020 Table HC7.1: Air conditioning in U.S. homes, by housing unit type, 2020. 2020. Accessed 2026-11-02.
- [3] U.S. Energy Information Administration. RECS 2020 public use microdata file, version 7 (18,496 households). 2020. Accessed 2026-11-02.
- [4] U.S. Energy Information Administration. Using the RECS 2020 microdata file to compute estimates and standard errors (June 2023). 2020. Accessed 2026-11-02.
- [5] U.S. Energy Information Administration. RECS 2020 codebook for public file, version 7. 2020. Accessed 2026-11-02.
- [6] U.S. Energy Information Administration. RECS 2020 state data page (housing characteristics release date March 29, 2023). 2020. Accessed 2026-11-02.
- [7] U.S. Energy Information Administration. RECS 2024 housing characteristics tables page (air conditioning tables: data will be released in spring 2027). 2024. Accessed 2026-11-02.
- [8] U.S. Energy Information Administration. RECS 2024 Table HC11.1: Household energy insecurity, 2024 (preliminary, March 2026). 2024. Accessed 2026-11-02.
- [9] U.S. Energy Information Administration. RECS 2024 public use microdata file, version 1 (16,676 households). 2024. Accessed 2026-11-02.
- [10] U.S. Census Bureau and HUD. AHS 2023 Table Specifications and PUF Estimates for User Verification (Table C-03-AO). 2023. Accessed 2026-11-02.
- [11] U.S. Census Bureau and HUD. AHS 2021 Table Specifications and PUF Estimates for User Verification (Table C-03-AO). 2021. Accessed 2026-11-02.
- [12] U.S. Census Bureau and HUD. AHS 2019 Table Specifications and PUF Estimates for User Verification (Table C-03-AO). 2019. Accessed 2026-11-02.
- [13] U.S. Census Bureau and HUD. AHS 2017 Table Specifications and PUF Estimates for User Verification (Table C-03-AO). 2017. Accessed 2026-11-02.
- [14] U.S. Census Bureau and HUD. AHS 2013 National Summary Tables v1.2 (Table C-03-AO). 2013. Accessed 2026-11-02.
- [15] U.S. Census Bureau and HUD. AHS national public use files 1985 to 2015 (CSV). 1985 to 2015. Accessed 2026-11-02.
- [16] U.S. Census Bureau and HUD. AHS Subject Definitions and Table Index: 2015 to 2023 (primary air conditioning). 2015 to 2023. Accessed 2026-11-02.
- [17] U.S. Census Bureau. ACS 2025 1-year table-based summary file, table B25002 (occupancy status). 2025. Accessed 2026-11-02.
- [18] U.S. Census Bureau. ACS 2025 data release page (2025 ACS 1-year estimates, October 29, 2026). 2025. Accessed 2026-11-02.
- [19] U.S. Census Bureau. 2023 Local Air Conditioning Estimates (LACE), state file. 2023 (modeled from AHS 2023 and ACS 2019 to 2023). Accessed 2026-11-02.
- [20] U.S. Census Bureau. 2023 LACE Quick Guide (updated November 2026). 2023. Accessed 2026-11-02.
- [21] U.S. Census Bureau. Census Bureau Releases New Local Estimates of Air Conditioning Access (CB26.TPS.32, May 19, 2026). 2023. Accessed 2026-11-02.
- [22] U.S. Census Bureau and HUD. AHS 2015 Historical Changes (primary and secondary air conditioning stubs). 2013 to 2015. Accessed 2026-11-02.
Tier 3: journalism and expert commentary (3)
- [23] Newsweek. Newsweek: Map shows states with worst air conditioning access (July 4, 2026). 2020 and 2023. Accessed 2026-11-02.
- [24] Filterbuy. U.S. Cities That Lack Air Conditioning (August 13, 2026). AHS metro data. Accessed 2026-11-02.
- [25] ACHR News. Snapshot of Residential A/C Market (December 25, 2017). 2016. Accessed 2026-11-02.