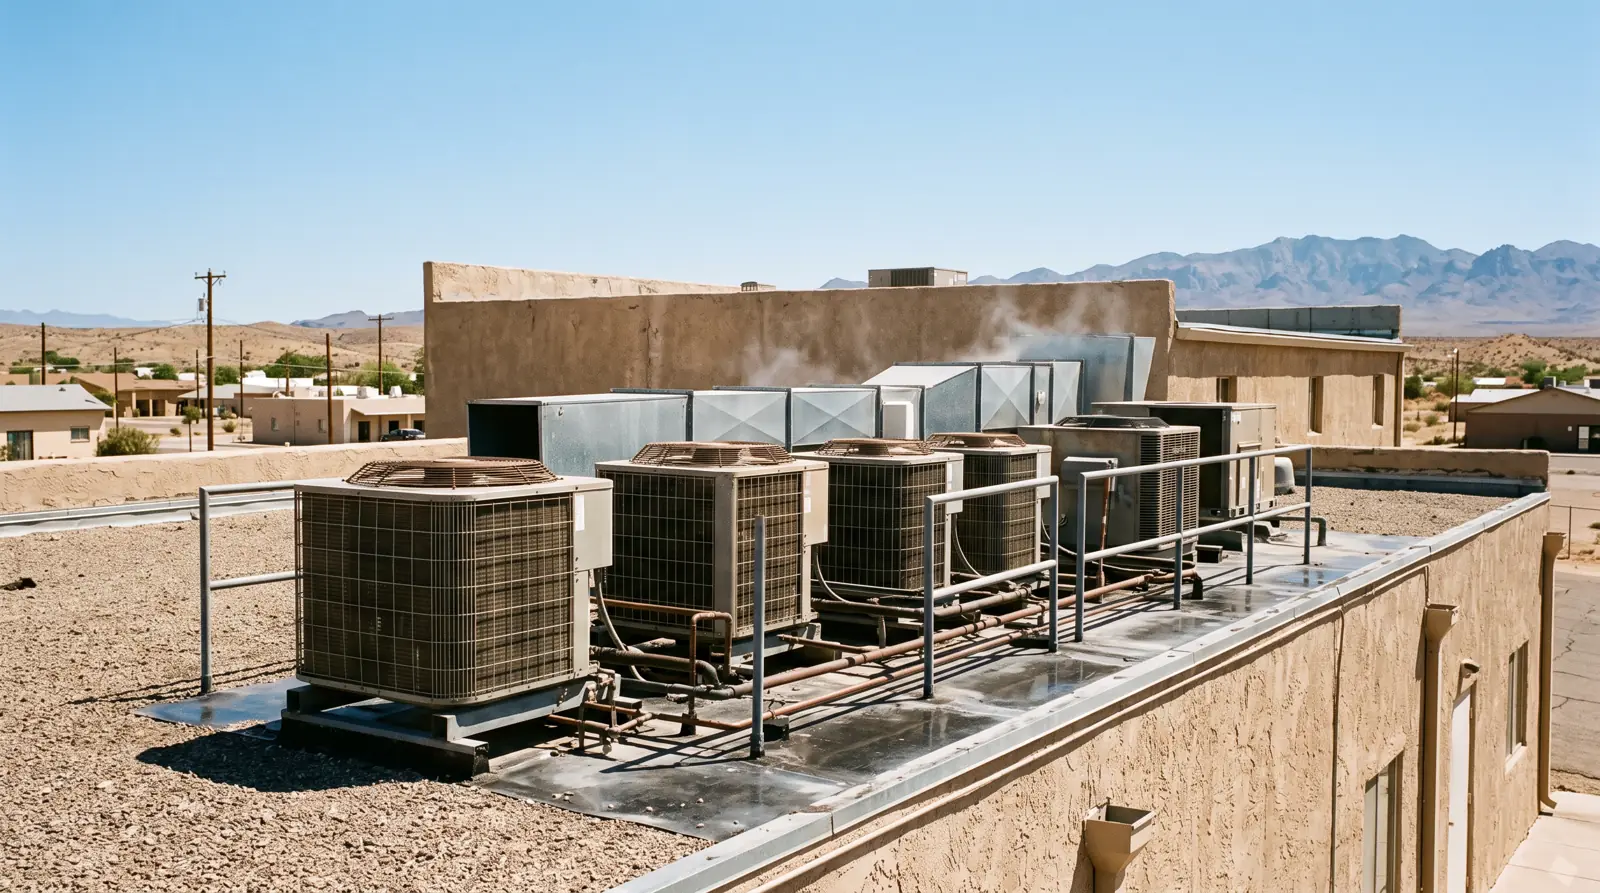
Cooling Degree Days by State: How Much More Air Conditioning Demand the Weather Creates (1991-2025)
- Primary data
- NOAA NCEI nClimDiv statewide degree days, version v1.0.0-20261006 (population-weighted, base 65F)
- Data period
- 1991 to 2025 annual; January to September 2026 preliminary
- Latest release used
- 2026-10-06
- Next release
- Monthly; NOAA reprocesses nClimDiv each month and revises the latest two calendar years
- Geography
- 48 contiguous states and the contiguous US (Alaska and Hawaii have no degree-day values)
- Sources
- 22 (19 Tier 1)
Contiguous US cooling degree days averaged 1,508 a year in 2016-2025, 18.7% more than the 1991-2000 average of 1,270, according to NOAA nClimDiv population-weighted data. Cooling degree days by state rose in all 48 contiguous states, from 10.7% in Arkansas to 58.2% in Vermont, while heating degree days fell 8.2% nationally.
This month in brief
- Contiguous US cooling degree days averaged 1,508 a year in 2016-2025, up 18.7% from 1,270 in 1991-2000 (NOAA nClimDiv, population-weighted, 2020 weights fixed).
- All 48 contiguous states gained cooling degree days; percent gains ranged from 10.7% in Arkansas to 58.2% in Vermont.
- Florida added the most cooling degree days per year (478.0), followed by Texas (400.4) and Arizona (368.1).
- Heating degree days fell 8.2% nationally; total degree days (cooling plus heating) rose only in Florida, Arizona, Texas, Nevada and Louisiana.
- At each resident's location, cooling degree days rose 26.0%, and population moving to hotter climate divisions accounts for 24.7% of that rise (our decomposition of NOAA division data).
- The cooling share of total degree days rose from 22.5% to 27.3% nationally and rose in all 48 states.
- 2025 was above the 1991-2020 cooling normal in all 48 states; January to September 2026 (1,524) is the highest for those months since 1895, on preliminary data.
Cooling degree days by state: Florida, Arizona and Texas lead, Montana and Washington trail
In the 2016-2025 average, Florida recorded 3,926 cooling degree days a year, more than 16 times Montana's 236. Five states now log more cooling than heating degree days.
Cooling degree day (CDD): For each day, the number of degrees Fahrenheit by which the mean temperature exceeds 65F; a 78F day adds 13 CDD. Heating degree days (HDD) count degrees below 65F. Annual values are the sum of daily values (EIA). The state figures here are population-weighted: each climate division counts in proportion to the people living in it, so the number describes where residents live, not the average acre.
Ranked by the 2016-2025 average, the top five states for cooling degree days were Florida (3,926), Arizona (3,267), Texas (3,092), Louisiana (2,941) and Mississippi (2,398), per NOAA nClimDiv. Nevada followed with 2,343. The lowest were Montana (236), Washington (244), Vermont (287) and Maine (298).
Show all 49 rows
| Rank (CDD) | State | Avg CDD 2016-2025 | Avg HDD 2016-2025 | Cooling share 1991-2000 (%) | Cooling share 2016-2025 (%) | Change (points) |
|---|---|---|---|---|---|---|
| 1 | Florida | 3926.0 | 522.1 | 84.0 | 88.3 | 4.3 |
| 2 | Arizona | 3267.2 | 1807.0 | 59.1 | 64.4 | 5.3 |
| 3 | Texas | 3091.6 | 1624.5 | 59.1 | 65.6 | 6.5 |
| 4 | Louisiana | 2941.2 | 1434.0 | 60.4 | 67.2 | 6.8 |
| 5 | Mississippi | 2397.8 | 2105.3 | 46.2 | 53.2 | 7.0 |
| 6 | Nevada | 2343.3 | 3330.7 | 36.5 | 41.3 | 4.8 |
| 7 | Alabama | 2108.6 | 2378.2 | 40.3 | 47.0 | 6.7 |
| 8 | South Carolina | 2066.9 | 2334.5 | 40.5 | 47.0 | 6.5 |
| 9 | Oklahoma | 2056.5 | 3303.8 | 33.6 | 38.4 | 4.8 |
| 10 | Arkansas | 1882.2 | 3148.0 | 32.9 | 37.4 | 4.5 |
| 11 | Georgia | 1872.4 | 2495.8 | 35.8 | 42.9 | 7.1 |
| 12 | North Carolina | 1590.8 | 3080.6 | 28.1 | 34.1 | 6.0 |
| 13 | Kansas | 1558.8 | 4636.1 | 21.6 | 25.2 | 3.6 |
| 14 | Tennessee | 1535.1 | 3457.2 | 25.6 | 30.7 | 5.1 |
| 15 | Missouri | 1384.2 | 4694.3 | 18.9 | 22.8 | 3.9 |
| 16 | Kentucky | 1338.3 | 4086.5 | 20.3 | 24.7 | 4.4 |
| 17 | Maryland | 1259.1 | 4252.9 | 18.0 | 22.8 | 4.8 |
| 18 | Delaware | 1254.8 | 4216.0 | 17.8 | 22.9 | 5.1 |
| 19 | Virginia | 1251.3 | 3955.5 | 19.0 | 24.0 | 5.0 |
| 20 | New Mexico | 1169.4 | 4214.5 | 16.5 | 21.7 | 5.2 |
| 21 | Nebraska | 1107.4 | 6037.6 | 12.6 | 15.5 | 2.9 |
| 22 | California | 1075.0 | 2664.1 | 22.1 | 28.8 | 6.7 |
| 23 | Indiana | 997.2 | 5308.4 | 13.0 | 15.8 | 2.8 |
| 24 | New Jersey | 991.2 | 4850.4 | 12.2 | 17.0 | 4.8 |
| 25 | Illinois | 984.7 | 5802.3 | 11.9 | 14.5 | 2.6 |
| 26 | Iowa | 909.7 | 6532.8 | 9.8 | 12.2 | 2.4 |
| 27 | West Virginia | 905.2 | 4755.1 | 12.5 | 16.0 | 3.5 |
| 28 | Ohio | 904.8 | 5315.6 | 11.0 | 14.5 | 3.5 |
| 29 | Pennsylvania | 809.7 | 5376.3 | 9.6 | 13.1 | 3.5 |
| 30 | South Dakota | 773.8 | 7455.0 | 7.4 | 9.4 | 2.0 |
| 31 | New York | 723.2 | 5653.1 | 8.0 | 11.3 | 3.3 |
| 32 | Connecticut | 716.9 | 5488.5 | 8.1 | 11.6 | 3.5 |
| 33 | Michigan | 679.0 | 6332.2 | 6.9 | 9.7 | 2.8 |
| 34 | Rhode Island | 666.4 | 5406.7 | 7.6 | 11.0 | 3.4 |
| 35 | Utah | 644.0 | 6753.8 | 6.2 | 8.7 | 2.5 |
| 36 | Massachusetts | 633.4 | 5736.9 | 6.5 | 9.9 | 3.4 |
| 37 | Idaho | 582.2 | 6720.5 | 5.7 | 8.0 | 2.3 |
| 38 | Wisconsin | 579.8 | 7191.9 | 5.7 | 7.5 | 1.8 |
| 39 | Minnesota | 524.0 | 8250.8 | 4.4 | 6.0 | 1.6 |
| 40 | North Dakota | 520.1 | 8975.1 | 4.1 | 5.5 | 1.4 |
| 41 | Colorado | 384.2 | 6865.3 | 3.7 | 5.3 | 1.6 |
| 42 | New Hampshire | 380.0 | 7041.6 | 3.2 | 5.1 | 1.9 |
| 43 | Wyoming | 323.8 | 8053.3 | 2.7 | 3.9 | 1.2 |
| 44 | Oregon | 313.2 | 5121.6 | 3.7 | 5.8 | 2.1 |
| 45 | Maine | 298.0 | 7351.4 | 2.6 | 3.9 | 1.3 |
| 46 | Vermont | 286.9 | 7649.4 | 2.1 | 3.6 | 1.5 |
| 47 | Washington | 244.0 | 5468.9 | 2.8 | 4.3 | 1.5 |
| 48 | Montana | 236.3 | 8392.5 | 1.9 | 2.7 | 0.8 |
| Contiguous US | 1507.7 | 4007.5 | 22.5 | 27.3 | 4.8 |
Cooling share = CDD / (CDD + HDD) x 100 for each 10-year average. Ranked by average CDD 2016-2025.
Source: [1][2] NOAA National Centers for Environmental Information; NOAA National Centers for Environmental Information
Heating degree days still dominate the national total: the contiguous US averaged 1,508 cooling and 4,008 heating degree days a year in 2016-2025. Cooling made up more than half of the total in five states: Florida (88.3%), Louisiana (67.2%), Texas (65.6%), Arizona (64.4%) and Mississippi (53.2%). Mississippi crossed the halfway mark between the two decades, up from 46.2%.
For an HVAC owner, the level matters more than the trend when sizing a service business: a Florida contractor's customers run cooling against roughly 16 times as many degree days as a Montana contractor's, and in Florida cooling makes up 88.3% of the weather load.
All 48 contiguous states gained cooling degree days, and the coolest states gained the most in percent
Comparing ten-year averages, cooling degree days rose 18.7% for the contiguous US and in every one of the 48 states. The median state gained 24.8%; 30 states rose faster than the national figure.
The contiguous US averaged 1,270 cooling degree days a year in 1991-2000 and 1,508 in 2016-2025, an increase of 237.9 a year or 18.7%, computed from NOAA nClimDiv statewide files with population weights held at 2020 levels. Because the weights are fixed, the change reflects weather, not population moves.
Ten-year averages, base 65F, population-weighted (2020 weights held fixed)
Source: NOAA NCEI nClimDiv v1.0.0-20261006; HVAC Business Brokers Research Desk calculation.
The largest percent gains came in states with little cooling to begin with: Vermont rose 58.2% (from 181.4 to 286.9), Oregon 52.4%, Washington 51.3% and New Hampshire 51.0%. The smallest were Arkansas (10.7%), Oklahoma (12.3%), Arizona (12.7%) and South Carolina (13.0%).
Absolute change in average annual CDD (base 65F)
Source: NOAA NCEI nClimDiv v1.0.0-20261006; HVAC Business Brokers Research Desk calculation.
Measured in added degree days, the ranking reverses. Florida added 478.0 cooling degree days a year, Texas 400.4, Arizona 368.1, Louisiana 351.8 and Nevada 321.8. Vermont's 58.2% gain amounts to 105.5 degree days, less than a quarter of Florida's increase.
Show all 49 rows
| Rank (% change) | State | Avg CDD 1991-2000 | Avg CDD 2016-2025 | Added CDD per year | Change (%) | Rank (added CDD) |
|---|---|---|---|---|---|---|
| 1 | Vermont | 181.4 | 286.9 | 105.5 | 58.2 | 44 |
| 2 | Oregon | 205.5 | 313.2 | 107.7 | 52.4 | 43 |
| 3 | Washington | 161.3 | 244.0 | 82.7 | 51.3 | 47 |
| 4 | New Hampshire | 251.6 | 380.0 | 128.4 | 51.0 | 38 |
| 5 | Massachusetts | 440.6 | 633.4 | 192.8 | 43.8 | 20 |
| 6 | Colorado | 272.1 | 384.2 | 112.1 | 41.2 | 42 |
| 7 | Maine | 211.0 | 298.0 | 87.0 | 41.2 | 46 |
| 8 | Montana | 168.0 | 236.3 | 68.3 | 40.7 | 48 |
| 9 | Wyoming | 232.2 | 323.8 | 91.6 | 39.4 | 45 |
| 10 | Idaho | 422.6 | 582.2 | 159.6 | 37.8 | 33 |
| 11 | Rhode Island | 485.1 | 666.4 | 181.3 | 37.4 | 29 |
| 12 | Utah | 471.6 | 644.0 | 172.4 | 36.6 | 30 |
| 13 | New York | 534.2 | 723.2 | 189.0 | 35.4 | 22 |
| 14 | Connecticut | 530.8 | 716.9 | 186.1 | 35.1 | 25 |
| 15 | New Jersey | 744.4 | 991.2 | 246.8 | 33.2 | 11 |
| 16 | Michigan | 511.2 | 679.0 | 167.8 | 32.8 | 31 |
| 17 | Pennsylvania | 623.2 | 809.7 | 186.5 | 29.9 | 24 |
| 18 | Minnesota | 403.6 | 524.0 | 120.4 | 29.8 | 39 |
| 19 | North Dakota | 401.5 | 520.1 | 118.6 | 29.5 | 40 |
| 20 | California | 830.5 | 1075.0 | 244.5 | 29.4 | 12 |
| 21 | New Mexico | 908.2 | 1169.4 | 261.2 | 28.8 | 7 |
| 22 | South Dakota | 615.6 | 773.8 | 158.2 | 25.7 | 34 |
| 23 | Ohio | 721.7 | 904.8 | 183.1 | 25.4 | 27 |
| 24 | Delaware | 1003.0 | 1254.8 | 251.8 | 25.1 | 9 |
| 25 | Wisconsin | 465.8 | 579.8 | 114.0 | 24.5 | 41 |
| 26 | West Virginia | 739.8 | 905.2 | 165.4 | 22.4 | 32 |
| 27 | Maryland | 1031.2 | 1259.1 | 227.9 | 22.1 | 15 |
| 28 | Virginia | 1033.5 | 1251.3 | 217.8 | 21.1 | 17 |
| 29 | Iowa | 752.7 | 909.7 | 157.0 | 20.9 | 35 |
| 30 | Nebraska | 919.3 | 1107.4 | 188.1 | 20.5 | 23 |
| 31 | Illinois | 836.5 | 984.7 | 148.2 | 17.7 | 36 |
| 32 | North Carolina | 1361.9 | 1590.8 | 228.9 | 16.8 | 14 |
| 33 | Indiana | 854.8 | 997.2 | 142.4 | 16.7 | 37 |
| 34 | Kentucky | 1147.6 | 1338.3 | 190.7 | 16.6 | 21 |
| 35 | Missouri | 1186.7 | 1384.2 | 197.5 | 16.6 | 19 |
| 36 | Tennessee | 1323.6 | 1535.1 | 211.5 | 16.0 | 18 |
| 37 | Nevada | 2021.5 | 2343.3 | 321.8 | 15.9 | 5 |
| 38 | Georgia | 1624.2 | 1872.4 | 248.2 | 15.3 | 10 |
| 39 | Texas | 2691.2 | 3091.6 | 400.4 | 14.9 | 2 |
| 40 | Mississippi | 2098.6 | 2397.8 | 299.2 | 14.3 | 6 |
| 41 | Florida | 3448.0 | 3926.0 | 478.0 | 13.9 | 1 |
| 42 | Alabama | 1853.8 | 2108.6 | 254.8 | 13.7 | 8 |
| 43 | Louisiana | 2589.4 | 2941.2 | 351.8 | 13.6 | 4 |
| 44 | Kansas | 1373.4 | 1558.8 | 185.4 | 13.5 | 26 |
| 45 | South Carolina | 1829.6 | 2066.9 | 237.3 | 13.0 | 13 |
| 46 | Arizona | 2899.1 | 3267.2 | 368.1 | 12.7 | 3 |
| 47 | Oklahoma | 1831.5 | 2056.5 | 225.0 | 12.3 | 16 |
| 48 | Arkansas | 1700.2 | 1882.2 | 182.0 | 10.7 | 28 |
| Contiguous US | 1269.8 | 1507.7 | 237.9 | 18.7 |
Base 65F. Population-weighted statewide values from NOAA nClimDiv v1.0.0-20261006, weights fixed at 2020 climate-division populations, so the change reflects weather only. Ten-year means of annual totals. Alaska and Hawaii have no degree-day values in the file.
Source: [1][5] NOAA National Centers for Environmental Information; NOAA National Centers for Environmental Information
Percent change tells an owner in the North that summer cooling demand has grown faster than equipment in older homes may have been sized for. Added degree days tell a Sun Belt owner how many more degrees of cooling their customers' systems work against each year than in the 1990s.
Heating degree days fell in every state, but only five states ended up with more total weather load
Heating degree days dropped 8.2% for the contiguous US between the two decades. In 43 states the heating loss was larger than the cooling gain; Florida, Arizona, Texas, Nevada and Louisiana gained total degree days.
Contiguous US heating degree days averaged 4,366 a year in 1991-2000 and 4,008 in 2016-2025, a drop of 358.9 or 8.2% (NOAA nClimDiv HDD file). Florida had the largest percent drop (20.7%), followed by Louisiana (15.6%) and Georgia (14.2%). Vermont had the largest absolute drop, 637.8 heating degree days a year, followed by Michigan (583.0).
Show all 49 rows
| State | Avg HDD 1991-2000 | Avg HDD 2016-2025 | Change in HDD | Change (%) | Added CDD | Net change in CDD + HDD |
|---|---|---|---|---|---|---|
| Florida | 658.0 | 522.1 | -135.9 | -20.7 | 478.0 | 342.1 |
| Louisiana | 1698.9 | 1434.0 | -264.9 | -15.6 | 351.8 | 86.9 |
| Georgia | 2908.1 | 2495.8 | -412.3 | -14.2 | 248.2 | -164.1 |
| Mississippi | 2444.5 | 2105.3 | -339.2 | -13.9 | 299.2 | -40.0 |
| Alabama | 2740.9 | 2378.2 | -362.7 | -13.2 | 254.8 | -107.9 |
| South Carolina | 2684.3 | 2334.5 | -349.8 | -13.0 | 237.3 | -112.5 |
| Texas | 1864.9 | 1624.5 | -240.4 | -12.9 | 400.4 | 160.0 |
| North Carolina | 3476.9 | 3080.6 | -396.3 | -11.4 | 228.9 | -167.4 |
| Tennessee | 3854.9 | 3457.2 | -397.7 | -10.3 | 211.5 | -186.2 |
| Virginia | 4396.9 | 3955.5 | -441.4 | -10.0 | 217.8 | -223.6 |
| Arizona | 2005.2 | 1807.0 | -198.2 | -9.9 | 368.1 | 169.9 |
| Maryland | 4698.7 | 4252.9 | -445.8 | -9.5 | 227.9 | -217.9 |
| Kentucky | 4507.4 | 4086.5 | -420.9 | -9.3 | 190.7 | -230.2 |
| New Jersey | 5346.5 | 4850.4 | -496.1 | -9.3 | 246.8 | -249.3 |
| Delaware | 4638.6 | 4216.0 | -422.6 | -9.1 | 251.8 | -170.8 |
| Arkansas | 3460.4 | 3148.0 | -312.4 | -9.0 | 182.0 | -130.4 |
| California | 2920.0 | 2664.1 | -255.9 | -8.8 | 244.5 | -11.4 |
| Massachusetts | 6290.8 | 5736.9 | -553.9 | -8.8 | 192.8 | -361.1 |
| Oklahoma | 3618.9 | 3303.8 | -315.1 | -8.7 | 225.0 | -90.1 |
| Ohio | 5817.5 | 5315.6 | -501.9 | -8.6 | 183.1 | -318.8 |
| West Virginia | 5202.0 | 4755.1 | -446.9 | -8.6 | 165.4 | -281.5 |
| New York | 6178.8 | 5653.1 | -525.7 | -8.5 | 189.0 | -336.7 |
| Rhode Island | 5911.6 | 5406.7 | -504.9 | -8.5 | 181.3 | -323.6 |
| Michigan | 6915.2 | 6332.2 | -583.0 | -8.4 | 167.8 | -415.2 |
| Connecticut | 5987.9 | 5488.5 | -499.4 | -8.3 | 186.1 | -313.3 |
| New Mexico | 4597.8 | 4214.5 | -383.3 | -8.3 | 261.2 | -122.1 |
| Pennsylvania | 5860.1 | 5376.3 | -483.8 | -8.3 | 186.5 | -297.3 |
| Vermont | 8287.2 | 7649.4 | -637.8 | -7.7 | 105.5 | -532.3 |
| Missouri | 5077.9 | 4694.3 | -383.6 | -7.6 | 197.5 | -186.1 |
| New Hampshire | 7617.8 | 7041.6 | -576.2 | -7.6 | 128.4 | -447.8 |
| Indiana | 5736.8 | 5308.4 | -428.4 | -7.5 | 142.4 | -286.0 |
| Maine | 7927.3 | 7351.4 | -575.9 | -7.3 | 87.0 | -488.9 |
| Kansas | 4979.3 | 4636.1 | -343.2 | -6.9 | 185.4 | -157.8 |
| Illinois | 6194.5 | 5802.3 | -392.2 | -6.3 | 148.2 | -244.0 |
| Wisconsin | 7661.3 | 7191.9 | -469.4 | -6.1 | 114.0 | -355.4 |
| Iowa | 6931.9 | 6532.8 | -399.1 | -5.8 | 157.0 | -242.1 |
| Nebraska | 6391.8 | 6037.6 | -354.2 | -5.5 | 188.1 | -166.1 |
| Nevada | 3523.3 | 3330.7 | -192.6 | -5.5 | 321.8 | 129.2 |
| Minnesota | 8681.6 | 8250.8 | -430.8 | -5.0 | 120.4 | -310.4 |
| Utah | 7075.3 | 6753.8 | -321.5 | -4.5 | 172.4 | -149.1 |
| Colorado | 7146.6 | 6865.3 | -281.3 | -3.9 | 112.1 | -169.2 |
| South Dakota | 7745.9 | 7455.0 | -290.9 | -3.8 | 158.2 | -132.7 |
| North Dakota | 9298.3 | 8975.1 | -323.2 | -3.5 | 118.6 | -204.6 |
| Wyoming | 8339.2 | 8053.3 | -285.9 | -3.4 | 91.6 | -194.3 |
| Montana | 8678.8 | 8392.5 | -286.3 | -3.3 | 68.3 | -218.0 |
| Oregon | 5290.0 | 5121.6 | -168.4 | -3.2 | 107.7 | -60.7 |
| Idaho | 6936.5 | 6720.5 | -216.0 | -3.1 | 159.6 | -56.4 |
| Washington | 5622.3 | 5468.9 | -153.4 | -2.7 | 82.7 | -70.7 |
| Contiguous US | 4366.4 | 4007.5 | -358.9 | -8.2 | 237.9 | -121.0 |
Sorted by percent change in heating degree days (largest drop first). Net change adds the CDD gain and the HDD loss; it is an index of weather load, not energy use.
Source: [2][1] NOAA National Centers for Environmental Information; NOAA National Centers for Environmental Information
Adding the cooling gain to the heating loss, total degree days rose in only five states: Florida (342.1), Arizona (169.9), Texas (160.0), Nevada (129.2) and Louisiana (86.9). Nationally, total degree days fell 121.0 a year. A degree of heating and a degree of cooling do not cost the same energy, so this sum is an index of weather load, not of fuel use.
For a company that earns from both furnace and air conditioning work, the weather mix has moved toward cooling everywhere, but only in the hottest five states has the combined weather load on equipment grown.
A quarter of the added cooling demand came from where Americans moved
Measured at the location of each resident, cooling degree days rose 26.0% between 1991-2000 and 2016-2025. Warmer weather explains 234.2 of the 310.9 added degree days; population moving into hotter climate divisions explains 76.7, or 24.7%.
NOAA's national series keeps 2020 population weights fixed for every year, which isolates the weather. EIA's series in the Monthly Energy Review instead weights states by the population of the same year, so it also captures people moving between states. EIA's US cooling degree days rose from a 1991-2000 mean of 1,210 to 1,527 in 2016-2025, a 26.2% increase, against 18.7% in the fixed-weight NOAA series.
NOAA holds 2020 population weights fixed; EIA uses each year's state populations
Source: NOAA NCEI nClimDiv v1.0.0-20261006; EIA Monthly Energy Review Table 1.12 (October 2026).
To split the two effects, we rebuilt the national figure from 344 climate-division series using NOAA division populations for 1990, 2000 and 2020. With 1990s populations and 1991-2000 weather, the average resident experienced 1,197 cooling degree days a year. With 2020 populations and 2016-2025 weather, the figure is 1,508, up 310.9 or 26.0%, close to EIA's 26.2%.
Change between 1991-2000 and 2016-2025, contiguous US, degree days per year
Source: NOAA NCEI nClimDiv divisional files and climate-division populations; HVAC Business Brokers Research Desk decomposition.
| Measure | 1991-2000 weather, 1990s population | 1991-2000 weather, 2020 population | 2016-2025 weather, 2020 population | Total change | Total change (%) | Weather part | Population-shift part | Population-shift share (%) |
|---|---|---|---|---|---|---|---|---|
| Cooling degree days | 1197.1 | 1269.8 | 1508.0 | 310.9 | 26.0 | 234.2 | 76.7 | 24.7 |
| Heating degree days | 4524.3 | 4366.4 | 4007.4 | -516.9 | -11.4 | -364.7 | -152.2 | 29.4 |
Computed from 344 climate-division degree-day series and NOAA's division populations. '1990s population' is the mean of the 1990 and 2000 census counts. Weather and population parts are the averages of the two possible orderings (a Shapley split), so they add to the total.
Source: [4][5] NOAA National Centers for Environmental Information; NOAA National Centers for Environmental Information
Of the 310.9 added cooling degree days, 234.2 come from warmer weather and 76.7 from population shift, a 24.7% share. Depending on which period's weights are used, the population part ranges from 72.7 to 80.6. Heating degree days experienced by the average resident fell 516.9, or 11.4%; population shift explains 152.2 of that drop (29.4%).
For the HVAC trade, this means the national installed base now sits in hotter places than it did in the 1990s, on top of the hotter weather in each place. Customers moving south and west bring more cooling hours with them.
2025 ran above normal in all 48 states, and January to September 2026 set a record
Every contiguous state finished 2025 above its 1991-2020 cooling degree day normal. The first nine months of 2026 produced the most cooling degree days for that period since records begin in 1895, on preliminary data.
The contiguous US recorded 1,502 cooling degree days in 2025, 10.5% above the 1991-2020 normal of 1,359 (NOAA nClimDiv normals). All 48 states were above normal. The largest departures were in Washington (63.7%) and Oregon (63.4%). Heating degree days were 4,062, 4.7% below the normal of 4,262, and 45 states were below their heating normal.
The record year in the series remains 2024: 1,600 cooling degree days, the most since 1895, and 3,721 heating degree days, the fewest.
From January to September 2026 the contiguous US logged 1,524 cooling degree days, 19.8% above the 1991-2020 normal of 1,272 for those months and above the previous January to September high of 1,478 set in 2018. All 48 states were above their January to September normal; Colorado (72.9%) and Wyoming (69.4%) led. Ten states set records for the period: Arizona, Arkansas, Colorado, Mississippi, Nevada, New Mexico, Oklahoma, Texas, Utah and Wyoming. NOAA's Climate Prediction Center, using a different station-based method, puts the US figure at 1,390, 15% above its normal (CPC September 2026 summary).
Show all 49 rows
| State | CDD 2025 | CDD normal 1991-2020 | 2025 vs normal (%) | HDD 2025 | HDD normal 1991-2020 | HDD 2025 vs normal (%) | CDD Jan-Sep 2026 (prelim.) | Jan-Sep normal | 2026 YTD vs normal (%) |
|---|---|---|---|---|---|---|---|---|---|
| Colorado | 348 | 328 | 6.1 | 6554 | 7053 | -7.1 | 567 | 328 | 72.9 |
| Wyoming | 332 | 278 | 19.4 | 7590 | 8224 | -7.7 | 471 | 278 | 69.4 |
| Montana | 237 | 195 | 21.5 | 8014 | 8549 | -6.3 | 290 | 195 | 48.7 |
| New Mexico | 1145 | 1002 | 14.3 | 3957 | 4462 | -11.3 | 1474 | 995 | 48.1 |
| Utah | 673 | 538 | 25.1 | 6172 | 6978 | -11.6 | 763 | 535 | 42.6 |
| Oklahoma | 2019 | 1919 | 5.2 | 3171 | 3535 | -10.3 | 2617 | 1865 | 40.3 |
| Arkansas | 1990 | 1763 | 12.9 | 3048 | 3393 | -10.2 | 2320 | 1712 | 35.5 |
| North Dakota | 474 | 444 | 6.8 | 8828 | 9184 | -3.9 | 601 | 444 | 35.4 |
| Idaho | 627 | 488 | 28.5 | 6232 | 6869 | -9.3 | 654 | 488 | 34.0 |
| Minnesota | 522 | 455 | 14.7 | 8152 | 8534 | -4.5 | 602 | 455 | 32.3 |
| South Dakota | 767 | 688 | 11.5 | 7159 | 7633 | -6.2 | 909 | 687 | 32.3 |
| Maine | 282 | 239 | 18.0 | 7662 | 7759 | -1.3 | 313 | 239 | 31.0 |
| Kansas | 1488 | 1457 | 2.1 | 4617 | 4878 | -5.4 | 1873 | 1436 | 30.4 |
| Missouri | 1413 | 1265 | 11.7 | 4680 | 4980 | -6.0 | 1616 | 1246 | 29.7 |
| California | 948 | 930 | 1.9 | 2518 | 2814 | -10.5 | 1118 | 878 | 27.3 |
| Tennessee | 1575 | 1415 | 11.3 | 3545 | 3753 | -5.5 | 1728 | 1378 | 25.4 |
| Mississippi | 2510 | 2181 | 15.1 | 2104 | 2388 | -11.9 | 2548 | 2060 | 23.7 |
| Kentucky | 1400 | 1227 | 14.1 | 4267 | 4396 | -2.9 | 1488 | 1204 | 23.6 |
| Texas | 3219 | 2808 | 14.6 | 1517 | 1820 | -16.6 | 3193 | 2586 | 23.5 |
| Nebraska | 1096 | 995 | 10.2 | 5808 | 6281 | -7.5 | 1220 | 989 | 23.4 |
| Arizona | 3330 | 3063 | 8.7 | 1563 | 1919 | -18.6 | 3484 | 2838 | 22.8 |
| Nevada | 2339 | 2166 | 8.0 | 2916 | 3451 | -15.5 | 2537 | 2073 | 22.4 |
| Virginia | 1212 | 1129 | 7.4 | 4154 | 4258 | -2.4 | 1353 | 1111 | 21.8 |
| Iowa | 953 | 809 | 17.8 | 6444 | 6821 | -5.5 | 976 | 803 | 21.5 |
| Wisconsin | 589 | 513 | 14.8 | 7344 | 7528 | -2.4 | 621 | 511 | 21.5 |
| New Hampshire | 386 | 300 | 28.7 | 7368 | 7449 | -1.1 | 364 | 300 | 21.3 |
| West Virginia | 949 | 802 | 18.3 | 5064 | 5067 | -0.1 | 952 | 792 | 20.2 |
| Washington | 298 | 182 | 63.7 | 5181 | 5610 | -7.6 | 217 | 182 | 19.2 |
| North Carolina | 1533 | 1470 | 4.3 | 3270 | 3359 | -2.6 | 1693 | 1427 | 18.6 |
| Alabama | 2092 | 1946 | 7.5 | 2505 | 2669 | -6.1 | 2168 | 1848 | 17.3 |
| Georgia | 1831 | 1726 | 6.1 | 2627 | 2807 | -6.4 | 1929 | 1648 | 17.1 |
| Louisiana | 3033 | 2695 | 12.5 | 1442 | 1652 | -12.7 | 2890 | 2476 | 16.7 |
| Delaware | 1171 | 1140 | 2.7 | 4547 | 4482 | 1.5 | 1304 | 1123 | 16.1 |
| Rhode Island | 633 | 562 | 12.6 | 5665 | 5761 | -1.7 | 650 | 561 | 15.9 |
| Michigan | 670 | 580 | 15.5 | 6634 | 6745 | -1.6 | 665 | 577 | 15.3 |
| Vermont | 301 | 223 | 35.0 | 7911 | 8059 | -1.8 | 257 | 223 | 15.2 |
| Illinois | 1038 | 888 | 16.9 | 5896 | 6104 | -3.4 | 1011 | 880 | 14.9 |
| Massachusetts | 587 | 517 | 13.5 | 6056 | 6134 | -1.3 | 593 | 516 | 14.9 |
| Indiana | 1041 | 912 | 14.1 | 5589 | 5627 | -0.7 | 1030 | 902 | 14.2 |
| South Carolina | 1973 | 1945 | 1.4 | 2512 | 2586 | -2.9 | 2118 | 1854 | 14.2 |
| Oregon | 379 | 232 | 63.4 | 4854 | 5268 | -7.9 | 264 | 232 | 13.8 |
| New Jersey | 926 | 858 | 7.9 | 5159 | 5168 | -0.2 | 963 | 851 | 13.2 |
| Maryland | 1209 | 1140 | 6.1 | 4519 | 4564 | -1.0 | 1269 | 1125 | 12.8 |
| Pennsylvania | 788 | 705 | 11.8 | 5721 | 5700 | 0.4 | 782 | 701 | 11.6 |
| Ohio | 910 | 793 | 14.8 | 5760 | 5688 | 1.3 | 876 | 786 | 11.5 |
| Florida | 3882 | 3581 | 8.4 | 614 | 645 | -4.8 | 3303 | 2975 | 11.0 |
| New York | 716 | 619 | 15.7 | 5920 | 6000 | -1.3 | 665 | 616 | 8.0 |
| Connecticut | 695 | 606 | 14.7 | 5765 | 5849 | -1.4 | 641 | 605 | 6.0 |
| Contiguous US | 1502 | 1359 | 10.5 | 4062 | 4262 | -4.7 | 1524 | 1272 | 19.8 |
Normals are nClimDiv 1991-2020 averages (period code 0010), which NOAA says are not official NCEI Normals. 2026 covers January to September and is preliminary; NOAA revises the latest two calendar years monthly. Sorted by the 2026 year-to-date departure.
Source: [1][2][3] NOAA National Centers for Environmental Information; NOAA National Centers for Environmental Information; NOAA National Centers for Environmental Information
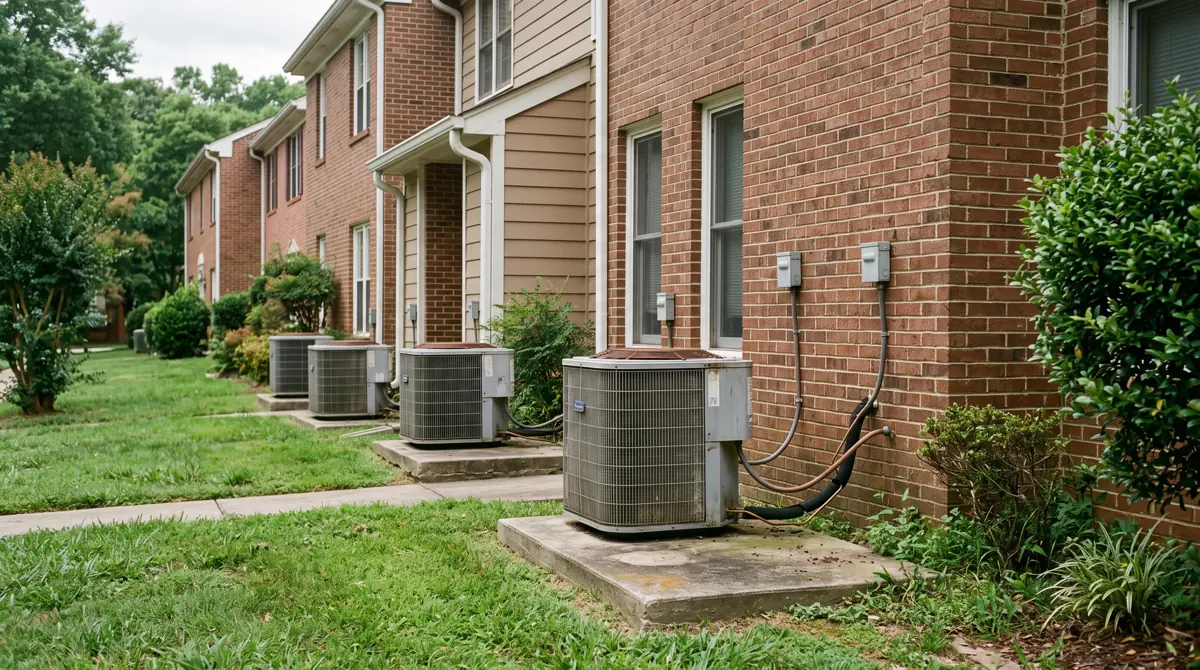
What a degree day can and cannot tell an HVAC owner
Degree days are the weather input EIA uses to model heating and cooling energy demand. They do not measure run hours, service calls or equipment failures.
EIA describes a cooling degree day as a measure of how much air conditioning a building needs, and uses population-weighted degree days to model and forecast energy consumption (EIA Energy Explained). Air conditioning used about 19% of US household electricity in 2020, or 254 billion kWh, per EIA's Residential Energy Consumption Survey (EIA FAQ).
For a given house and system, more degrees above 65F means more hours the compressor must run to hold the setpoint. The relationship is not one to one: insulation, humidity, thermostat habits, equipment size and efficiency all change how a degree day turns into run time, and this report does not estimate run hours.
The contiguous US June to August mean temperature, an area-weighted measure, rose 1.81F between the two decades, from 71.55F to 73.36F. Degree days rise faster than average temperature in percent terms because only the part above 65F counts.
Momentum and share analysis
Percent change in cooling degree days by state, 1991-2000 vs 2016-2025 (signature table)
Formulapct = (mean annual CDD 2016-2025 / mean annual CDD 1991-2000 - 1) x 100, per state, from NOAA nClimDiv statewide CDD (element 26)
Inputs: s1 annual sums by state; derived rows {ST}_cdd_p1, {ST}_cdd_p2, {ST}_cdd_pct in derived_metrics.csv (fact sheet rows)
Result: Contiguous US 18.7% (1,270 to 1,508). Range 10.7% (Arkansas) to 58.2% (Vermont); median state 24.8%; all 48 states positive.
Cooling demand from weather grew in every state; cool northern states grew fastest in percent, Sun Belt states most in absolute degree days.
Limitations: Two ten-year windows, not a trend fit. 2024 and 2025 may be revised. Population weights are fixed at 2020.
Weather vs population-shift decomposition of degree days experienced by the average resident (signature)
FormulaDD(period, weights) = sum over 344 divisions of DD_div x pop_div / sum pop_div, averaged over the period. Total = DD(2016-2025, 2020 pop) - DD(1991-2000, mean of 1990 and 2000 pop). Weather part = mean of the change at each weight set; population part = mean of the change at each weather period.
Inputs: s4 divisional CDD and HDD files; s5 division populations (1990, 2000, 2020); derived rows dec_cdd_* and dec_hdd_* (fact sheet rows)
Result: CDD: 1,197 to 1,508, +310.9 (26.0%); weather 234.2, population shift 76.7 (24.7%). HDD: 4,524 to 4,007, -516.9 (11.4% drop); weather -364.7, population shift -152.2 (29.4%).
About three quarters of the rise in cooling degree days at the places Americans live is warmer weather; about one quarter is people living in hotter places. EIA's same-year-weighted series (+26.2%) independently matches the 26.0% total.
Limitations: Moves within a climate division are invisible. Population between census years is not interpolated; the 1990s weight is a simple 1990/2000 mean. The population part ranges from 72.7 to 80.6 depending on the weather period used.
Heating degree day change and net weather load
FormulaHDD pct as in d1; net = CDD change + HDD change
Inputs: s2 and s1; derived rows {ST}_hdd_chg, {ST}_total_chg (fact sheet rows)
Result: Contiguous US HDD -8.2% (4,366 to 4,008); net degree days -121.0. Net rose only in Florida (342.1), Arizona (169.9), Texas (160.0), Nevada (129.2) and Louisiana (86.9).
Outside the hottest five states, smaller heating loads more than offset larger cooling loads in degree-day terms.
Limitations: A heating degree day and a cooling degree day imply different energy per degree; the sum is an index only.
Cooling share of total degree days
Formulashare = CDD / (CDD + HDD) x 100 for each ten-year mean
Inputs: derived rows {ST}_share_p1, {ST}_share_p2 (fact sheet rows)
Result: Contiguous US 22.5% to 27.3% (+4.8 points); rose in all 48 states; above 50% in Florida, Louisiana, Texas, Arizona and Mississippi in 2016-2025.
The weather mix in every state has tilted toward the cooling season.
Limitations: Not a revenue or energy share.
2025 and January to September 2026 vs the 1991-2020 normal
Formula(observed / nClimDiv 1991-2020 average - 1) x 100; Jan-Sep uses the sum of January to September monthly normals
Inputs: s1, s3; derived rows {ST}_cdd_25n, {ST}_cdd_26n, us_js_rank, n_rec26 (fact sheet rows)
Result: 2025: US +10.5%, 48 of 48 states above normal. Jan-Sep 2026: US +19.8% (1,524), highest Jan-Sep since 1895; record in 10 states.
The last two seasons sit at the top of the record for cooling demand.
Limitations: 2026 is preliminary and covers nine months. nClimDiv normals are not official NCEI Normals.
Cross-check of nClimDiv against NOAA CPC
Formularatio = sum of 48 state CPC 2025 CDD / sum of nClimDiv 2025 CDD; Spearman rank correlation of state values
Inputs: s11, s12, s1; derived rows cpc_ratio, cpc_spearman, cpc_samesign (fact sheet rows)
Result: CPC levels are 0.909 times nClimDiv; state ranks agree closely (rho 0.991); 41 of 48 states agree on the sign of the 2026 year-to-date departure.
The two NOAA products rank states almost identically but differ in level, so values from one should not be compared with normals from the other.
Limitations: CPC uses station regression estimates and its own normals.
Findings to track
- Contiguous US cooling degree days averaged 1,508 a year in 2016-2025, up 18.7% from 1,270 in 1991-2000, at fixed 2020 population weights (NOAA nClimDiv).[1][5]
- Every one of the 48 contiguous states had more cooling degree days in 2016-2025 than in 1991-2000 (NOAA nClimDiv).[1]
- Vermont had the largest percent rise in cooling degree days, 58.2% (181.4 to 286.9 a year), between 1991-2000 and 2016-2025.[1]
- Arkansas had the smallest percent rise in cooling degree days, 10.7%, between 1991-2000 and 2016-2025.[1]
- Florida added 478.0 cooling degree days a year between 1991-2000 and 2016-2025, the largest absolute increase of any state; Texas added 400.4.[1]
- Florida averaged 3,926 cooling degree days a year in 2016-2025, the most in the contiguous US, followed by Arizona (3,267) and Texas (3,092).[1]
- Contiguous US heating degree days fell 8.2%, from 4,366 a year in 1991-2000 to 4,008 in 2016-2025 (NOAA nClimDiv).[2]
- Total degree days (cooling plus heating) rose between 1991-2000 and 2016-2025 in only five states: Florida, Arizona, Texas, Nevada and Louisiana.[1][2]
- Cooling degree days experienced by the average US resident rose 26.0% between 1991-2000 and 2016-2025; 24.7% of that rise came from population moving to hotter climate divisions.[4][5]
- EIA's US cooling degree day series, which uses same-year state populations, rose 26.2% between the 1991-2000 and 2016-2025 averages.[14][16]
- The cooling share of contiguous US degree days rose from 22.5% in 1991-2000 to 27.3% in 2016-2025.[1][2]
- In 2025 the contiguous US recorded 1,502 cooling degree days, 10.5% above the 1991-2020 normal of 1,359, with all 48 states above normal.[1][3]
- 2024 holds the contiguous US record for cooling degree days (1,600) and the low for heating degree days (3,721) in the 1895 to 2025 nClimDiv series.[1][2]
- January to September 2026 contiguous US cooling degree days reached 1,524, the highest for those months since 1895 (preliminary NOAA nClimDiv).[1]
Questions people ask
Which states have the most cooling degree days?
Florida, with 3,926 cooling degree days a year on average in 2016-2025, followed by Arizona (3,267), Texas (3,092), Louisiana (2,941) and Mississippi (2,398), per population-weighted NOAA nClimDiv data. Montana (236) and Washington (244) have the fewest.
Are cooling degree days increasing?
Yes. Contiguous US cooling degree days averaged 1,508 a year in 2016-2025, 18.7% more than in 1991-2000, and all 48 contiguous states rose. 2024 set the record at 1,600, and January to September 2026 (1,524) is the highest for those months since 1895 on preliminary NOAA data.
How much hotter have US summers become for air conditioning demand?
The contiguous US June to August mean temperature rose 1.81F between 1991-2000 and 2016-2025 (NOAA nClimDiv, area-weighted), while population-weighted cooling degree days rose 18.7%. Counting the move of residents to hotter places, the cooling degree days the average American experiences rose 26.0%.
Download the data
Every table in this report is available as a CSV under CC BY 4.0. The fact sheet lists each value with its source URL and access date.
For journalists and researchers
If you cite only a few, cite these
- US cooling degree days rose 18.7% from the 1991-2000 average (1,270) to the 2016-2025 average (1,508), NOAA nClimDiv, population-weighted, 2020 weights fixed.[1]
- Population moving to hotter climate divisions explains 24.7% of the 26.0% rise in cooling degree days experienced by the average US resident between 1991-2000 and 2016-2025.[4][5]
- January to September 2026: 1,524 US cooling degree days, 19.8% above the 1991-2020 normal and the highest for those months since 1895 (preliminary).[1][3]
Most quotable statistics
- US cooling degree days averaged 1,508 a year in 2016-2025, 18.7% more than in 1991-2000, according to NOAA nClimDiv data.[1]
- All 48 contiguous states had more cooling degree days in 2016-2025 than in 1991-2000, from a 10.7% rise in Arkansas to 58.2% in Vermont.[1]
- About a quarter (24.7%) of the rise in cooling degree days experienced by the average American since the 1990s came from people moving to hotter places, not from hotter weather.[4][5]
- Florida added 478.0 cooling degree days a year between 1991-2000 and 2016-2025, the largest increase of any state.[1]
- January to September 2026 brought 1,524 cooling degree days to the contiguous US, the most for those months since 1895 on preliminary NOAA data.[1]
- Total degree days, heating plus cooling, rose between 1991-2000 and 2016-2025 in only five states: Florida, Arizona, Texas, Nevada and Louisiana.[1][2]
Press summary
Cooling degree days in the contiguous United States averaged 1,508 a year in 2016-2025, 18.7% more than the 1991-2000 average of 1,270, and rose in all 48 contiguous states, from 10.7% in Arkansas to 58.2% in Vermont, according to an HVAC Business Brokers Research Desk analysis of NOAA nClimDiv population-weighted data. Counting where Americans now live, cooling degree days per resident rose 26.0%, and 24.7% of that increase came from population moving into hotter climate divisions rather than from warmer weather, while heating degree days fell 8.2% at fixed population. On preliminary data, January to September 2026 produced 1,524 cooling degree days nationally, 19.8% above the 1991-2020 normal and the most for those nine months since NOAA's record begins in 1895.
Suggested headlines
- US cooling degree days up 18.7% since the 1990s, and every contiguous state rose
- A quarter of America's added air conditioning demand comes from where people moved
- Vermont's cooling degree days up 58.2%, Florida adds 478.0 a year
- January to September 2026 sets a 1895-to-date record for US cooling degree days
- Only five states now face more total heating plus cooling weather than in the 1990s
How to cite this report
HVAC Business Brokers. (2026). Cooling Degree Days by State: How Much More Air Conditioning Demand the Weather Creates (1991-2025). Retrieved from https://sell-my-hvac-business.com/research/cooling-degree-days-by-state/
Reuse license
Data and tables are licensed CC BY 4.0. Attribution: “Source: HVAC Business Brokers, Cooling Degree Days by State: How Much More Air Conditioning Demand the Weather Creates (1991-2025)” with a link to this page.
Frequently asked questions
What is a cooling degree day?
A cooling degree day counts how many degrees Fahrenheit a day's mean temperature is above 65F. A day averaging 78F adds 13 cooling degree days. Annual totals sum the daily values (EIA).
Why 65F?
65F is the standard base temperature EIA and NOAA use for US degree days. It approximates the outdoor temperature above which buildings need cooling and below which they need heating.
Are these state numbers area-weighted or population-weighted?
Population-weighted. Rebuilding the statewide values from NOAA's climate divisions with 2020 census populations matches NOAA's files to within 0.69 cooling degree days on average, so 2020 weights are used for every year.
How many cooling degree days does Texas have?
Texas averaged 3,092 cooling degree days a year in 2016-2025, up 14.9% from 2,691 in 1991-2000. In 2025 Texas recorded 3,219.
How many cooling degree days does Florida have?
Florida averaged 3,926 cooling degree days a year in 2016-2025, the most in the contiguous US, up 13.9% from 3,448 in 1991-2000.
Which state's cooling degree days grew fastest?
Vermont, up 58.2% between the 1991-2000 and 2016-2025 averages, from 181.4 to 286.9 a year. In absolute terms Florida grew most, adding 478.0 a year.
Did heating degree days fall?
Yes. Contiguous US heating degree days averaged 4,008 a year in 2016-2025, 8.2% fewer than the 4,366 of 1991-2000, and every state fell.
Why does EIA show a bigger increase than NOAA?
EIA weights states by each year's population, so its series also captures people moving to hotter states. EIA's US cooling degree days rose 26.2% between the two decades, against 18.7% for NOAA's fixed-weight series.
Was 2025 a hot year for air conditioning?
Yes. The contiguous US recorded 1,502 cooling degree days in 2025, 10.5% above the 1991-2020 normal of 1,359, and all 48 states were above their normal. 2024 was higher at 1,600.
Why are Alaska and Hawaii missing?
NOAA's nClimDiv degree-day files carry no values for Alaska (every month is coded missing) and do not include Hawaii, so this report covers the 48 contiguous states.
Reproduce this analysis
Every figure comes from the files below. The scripts that pulled and computed them are kept with the report and can be re-run.
| Dataset | Publisher | Source | Query or filter | Rows used | Retrieved |
|---|---|---|---|---|---|
| nClimDiv statewide CDD and HDD (climdiv-cddcst, climdiv-hddcst) | NOAA NCEI | File or endpoint | State codes 001-048 and 110, division 0, elements 26 and 25, years 1991-2026; fixed-width f7.0 monthly values summed to annual (12 months) and Jan-Sep | 49 areas x 36 years x 2 elements = 3,528 area-years; 2026 rows have October to December coded -9999 | 2026-11-02 |
| nClimDiv statewide normals (climdiv-norm-cddcst, climdiv-norm-hddcst) | NOAA NCEI | File or endpoint | Period code 0010 (1991-2020), state codes 001-048 and 110 | 49 areas x 2 elements | 2026-11-02 |
| nClimDiv divisional CDD and HDD plus climate-division populations | NOAA NCEI | File or endpoint | Divisional files climdiv-cddcdv and climdiv-hddcdv, 344 divisions in states 01-48, years 1991-2000 and 2016-2025; populations for 1990, 2000, 2020 | 344 divisions x 20 years x 2 elements = 13,760 division-years | 2026-11-02 |
| CPC population-weighted cooling degree day monthly summaries | NOAA Climate Prediction Center | File or endpoint | December 2025 and September 2026 files, CUM TOTAL and CUM DEV FROM NORM PRCT columns | 48 states plus US, 2 files | 2026-11-02 |
| Monthly Energy Review Tables 1.11 and 1.12 | U.S. Energy Information Administration | File or endpoint | MSN ZWCDPUS and ZWHDPUS, annual rows (YYYY13), 1991-2025 | 35 years x 2 series | 2026-11-02 |
Data quality and exclusions
- Alaska (state code 050): all 12 months coded -9999 in every year of the degree-day files; excluded (1 state). Hawaii is not in the degree-day files (0 rows).
- 2026: October to December coded -9999 in all 49 areas; 2026 used as January to September sums only and labelled preliminary.
- Statewide weighting checked: 2020 division populations reproduce NOAA statewide CDD for 2000, 2015 and 2025 with mean absolute error 0.69 and maximum 3.7 degree days across 144 state-years; the readme's 2010 weights do not (mean 4.79).
- Decomposition: national values rebuilt from divisions differ from NOAA's code 110 by at most 1.3 degree days in the test years; division-built values are used only inside the decomposition.
- CPC files: 48 states and the US parsed; regional and customer-weighted rows ignored. CPC heating files accumulate from July 1, not January 1, so they were not used.
- EIA MER: annual rows are those with month code 13; monthly rows (around 7,200 in the CDD file) were not used.
Methodology
Source selection. The primary dataset is NOAA NCEI's nClimDiv statewide degree-day files, version v1.0.0-20261006 (processed 6 October 2026, data through September 2026), downloaded from https://www.ncei.noaa.gov/monitoring-content/data/us/climdiv/monthly/current/. nClimDiv is NOAA's gridded climate-division dataset built from GHCN-Daily stations with bias adjustments (state-readme). We used element 26 (CDD) and 25 (HDD), base 65F, for the 48 states and code 110 (contiguous US). The 1991-2020 normals are NOAA's nClimDiv averages (period code 0010).
Weighting. NOAA's readme says degree-day population weights use the 2010 Census. We tested this by rebuilding statewide values from the 344 divisional series: 2020 division populations reproduce NOAA's statewide CDD with a mean absolute error of 0.69 degree days, against 4.79 for 2010 populations, and also reproduce the national value. We therefore describe the series as population-weighted with fixed 2020 weights. Because weights are fixed, changes over time in the NOAA series are weather only.
Derived metrics. Ten-year means are means of annual totals (each the sum of 12 months). Percent changes compare the 2016-2025 mean with the 1991-2000 mean. The weather vs population decomposition recomputes the national value from divisions with 1990/2000-mean and 2020 populations and averages the two orderings so the parts add to the total. Every formula, input and result is in derived_metrics.csv; scripts/ rebuilds everything from raw/ without network access.
Conflicting numbers. NOAA CPC's population-weighted summaries use station regression estimates and give levels about 0.909 times nClimDiv for 2025, with state rankings nearly identical (Spearman 0.991). EIA's Monthly Energy Review series uses same-year population weights and NOAA state data; it differs from the NOAA national value because of those weights and its 50-state coverage. We report each with its own normal and never mix a value from one product with a normal from another.
Exclusions. Alaska is coded missing for every month in the degree-day files and Hawaii is absent, so neither is ranked. 2026 is reported for January to September only and labelled preliminary. Tier 3 pages (Climate Central, Shipley Energy via Stacker) are used only as pages to compare against, never for a figure in our tables.
Last update: 2 November 2026. NOAA reprocesses nClimDiv monthly and revises the latest two calendar years, so 2025 and 2026 values may change. A free valuation form is at /#valuation; it plays no part in this research.
This report presents published data with its limitations. It is not legal, financial or investment advice.
Sources, ranked by quality
Tier 1: primary and official sources (19)
- [1] NOAA National Centers for Environmental Information. nClimDiv statewide cooling degree days, v1.0.0-20261006. 1895 to September 2026. Accessed 2026-11-02.
- [2] NOAA National Centers for Environmental Information. nClimDiv statewide heating degree days, v1.0.0-20261006. 1895 to September 2026. Accessed 2026-11-02.
- [3] NOAA National Centers for Environmental Information. nClimDiv statewide degree-day normals (1991-2020 period code 0010), v1.0.0-20261006. 1991-2020. Accessed 2026-11-02.
- [4] NOAA National Centers for Environmental Information. nClimDiv divisional cooling and heating degree days, v1.0.0-20261006. 1895 to September 2026. Accessed 2026-11-02.
- [5] NOAA National Centers for Environmental Information. Climate division population file, 1900 to 2020 censuses. 1900-2020. Accessed 2026-11-02.
- [6] NOAA National Centers for Environmental Information. nClimDiv statewide file readme (state-readme.txt). documentation. Accessed 2026-11-02.
- [7] NOAA National Centers for Environmental Information. nClimDiv normals readme (normals-readme.txt). documentation. Accessed 2026-11-02.
- [8] NOAA National Centers for Environmental Information. nClimDiv statewide average temperature, v1.0.0-20261006. 1895 to September 2026. Accessed 2026-11-02.
- [9] NOAA National Climatic Data Center. nClimDiv: An Overview of NCDC's New Climate Division Dataset (briefing, 19 March 2014). 2014. Accessed 2026-11-02.
- [10] NOAA National Centers for Environmental Information. NOAA Monthly U.S. Climate Divisional Database (NClimDiv) dataset landing page. documentation. Accessed 2026-11-02.
- [11] NOAA Climate Prediction Center. Cooling degree day monthly summary, December 2025 (population-weighted state, regional and national). January to December 2025. Accessed 2026-11-02.
- [12] NOAA Climate Prediction Center. Cooling degree day monthly summary, September 2026 (population-weighted state, regional and national). January to September 2026. Accessed 2026-11-02.
- [13] NOAA Climate Prediction Center. Weekly and monthly degree day summaries explanation. documentation. Accessed 2026-11-02.
- [14] U.S. Energy Information Administration. Monthly Energy Review Table 1.12, Cooling Degree Days by Census Division (CSV). 1949 to 2026. Accessed 2026-11-02.
- [15] U.S. Energy Information Administration. Monthly Energy Review Table 1.11, Heating Degree Days by Census Division (CSV). 1949 to 2026. Accessed 2026-11-02.
- [16] U.S. Energy Information Administration. Monthly Energy Review, October 2026, Section 1 (table notes). October 2026 edition. Accessed 2026-11-02.
- [17] U.S. Energy Information Administration. Degree days (Energy Explained). documentation. Accessed 2026-11-02.
- [18] U.S. Energy Information Administration. FAQ: How much electricity is used for cooling in the United States?. RECS 2020, CBECS 2018. Accessed 2026-11-02.
- [19] NOAA National Centers for Environmental Information. nClimDiv processing date file (procdate.txt). 2026-10-06. Accessed 2026-11-02.
Tier 3: journalism and expert commentary (3)
- [20] Climate Central. Hotter Climate, Higher Cooling Demand (Climate Matters, 19 July 2023). 1970-2022. Accessed 2026-11-02.
- [21] Climate Central. Warming cities, higher cooling demand (Climate Matters, 5 August 2026). 1970s to 2025. Accessed 2026-11-02.
- [22] Stacker / Shipley Energy. How a hotter summer changes the cost of cooling your home (Shipley Energy analysis, syndicated by Stacker). 2001-2005 vs 2021-2025. Accessed 2026-11-02.